asw Intraday SetBest for intraday trading! Key levels to watch during intraday include Open price, high & low of the the and of yesterday's. These lines are plotted on the chart with VWAP in addition. Hope it helps!Pine Script®指標由asw23提供117
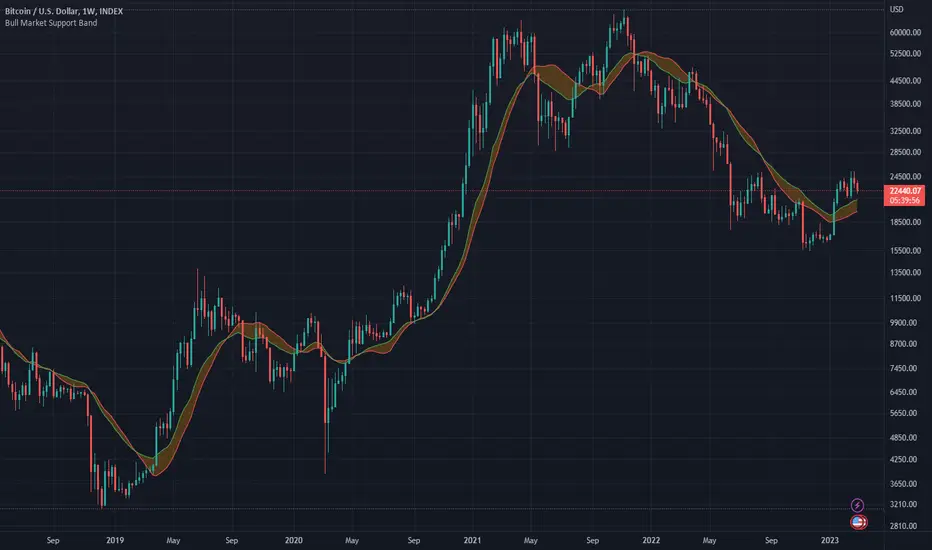
Bull Market Support Band (20w SMA, 21w EMA)This moving average indicator is a bull market support band. It's significance comes from the previous bull runs where the price was bouncing off or riding from a distance the support band until the end of the market cycle. For example, during the 2017 bull run, Bitcoin had several 30-40% corrections to the support band. The green line represents the 20 weeks simple moving average and the red line represents the 21 weeks exponential moving average. The best way to read the current value is to look at the weekly chart, but any time frame will display the same values. Pine Script®指標由zkdev提供已更新 5353 4.8 K
Ichimoku + 2 base linesIchimoku + 2 base line This indicator is a combination of Ichimoku cloud indicator with two base lines. The first base line is the same as the Ichimoku default settings but the baseline 2 indicates an average of 108 candles in the past and it acts as a strong support and resistance level. How to use this indicator? You can use this indicator to see if a break out is true or is a false break. For example if the price broke up the Ichimoku cloud and base line 2 is above the price, it will probably react to that area but if it's below the price, it is a good opportunity to buy. (for sell/short position it is in the opposite way the base line 2 should be above the price) If you want to trade in support zones base line 2 (108) is a very good area that you can wait for a good candlestick pattern to enter a position. Caution: before using this indicator please back test it and if the results were good enough, use it as a confirmation. Pine Script®指標由salarkamjoo提供已更新 368
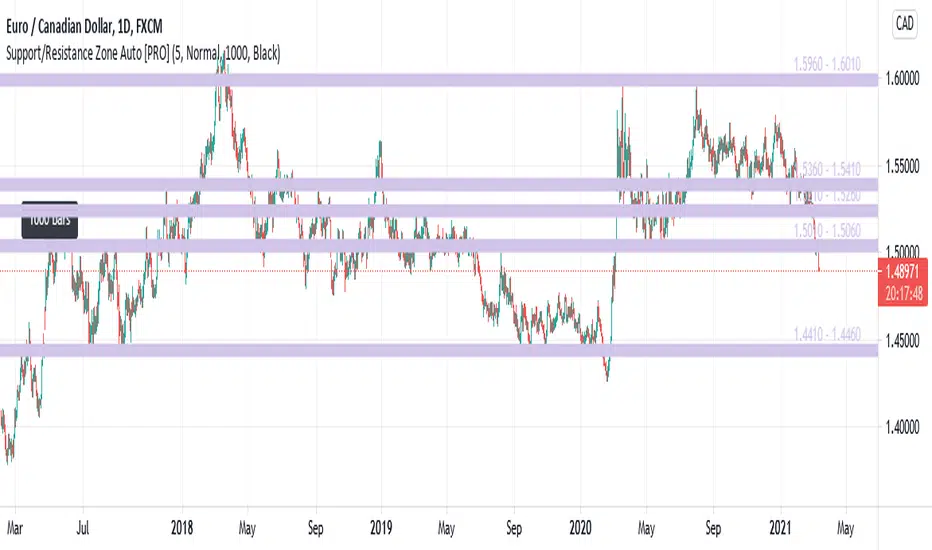
Support/Resistance Zone Auto [PRO]This is an indicator that automatically detects and displays support / resistance zones. It displays up to 5 zones with a large number of reversals. - Zone Color : Set the zone color. - Number Of Zones : Set the number of zones to display. Can be set from 1 to 5. - Zone Width : Set zone width. Selectable from "Very Wide", "Wide", "Normal", "Narrow", "Very Narrow". - Number Of Reference Bars : Set the number of bars to reference. Selectable from "500", "1000" and "1500". When "1000" is set, the past 1000 bars are referenced from the latest bar (current bar) to investigate the reversal status. - Reference Point Label : Set the color of the label displayed at the reference start position. Selectable from "Black", "White", and "None". If this parameter is "Black" and the "Number Of Reference Bars" parameter is "1000", a black label with "1000 bars" will be displayed 1000 bars before the current bar. - Increased maximum zone display from 3 to 5. - Zone color can be set with Input. - Display the price range of the zone (eg 1.5600 - 1.5650) - Display Reference Point Label. Pine Script®指標由HarmonicLab提供已更新 4482
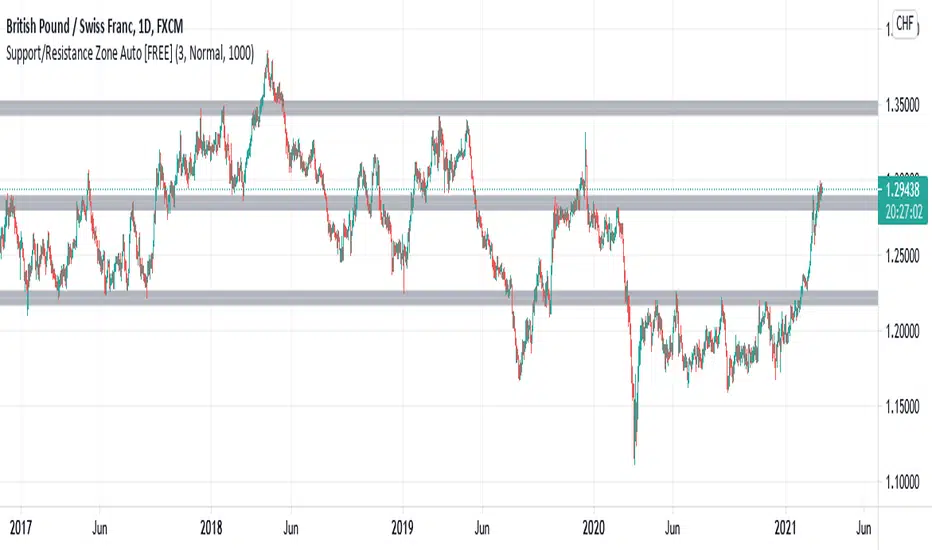
Support/Resistance Zone Auto [FREE]This is an indicator that automatically detects and displays support / resistance zones. It displays up to 3 zones with a large number of reversals. - Number Of Zones : Set the number of zones to display. Can be set from 1 to 3. - Zone Width : Set zone width. Selectable from "Very Wide", "Wide", "Normal", "Narrow", "Very Narrow". - Number Of Reference Bars : Set the number of bars to reference. Selectable from "500", "1000" and "1500". When "1000" is set, the past 1000 bars are referenced from the latest bar (current bar) to investigate the reversal status.Pine Script®指標由HarmonicLab提供已更新 22606
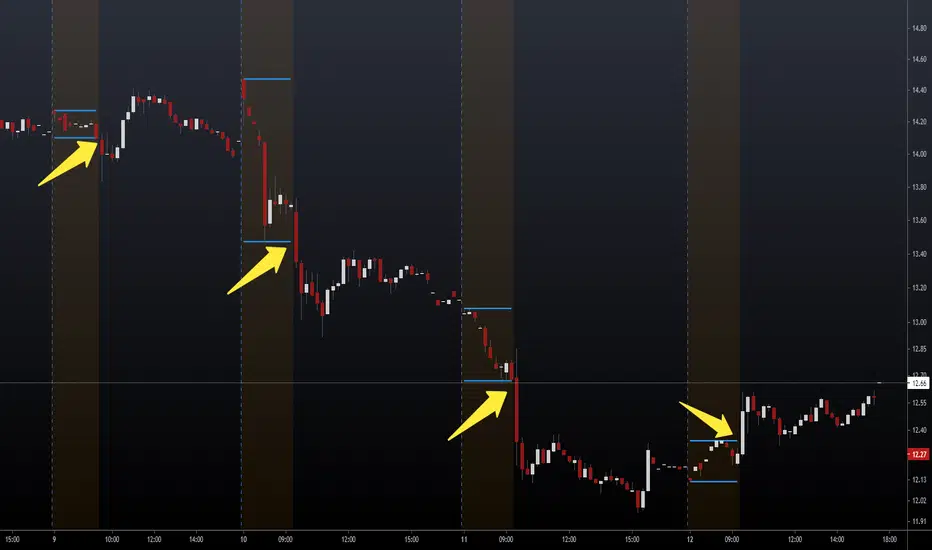
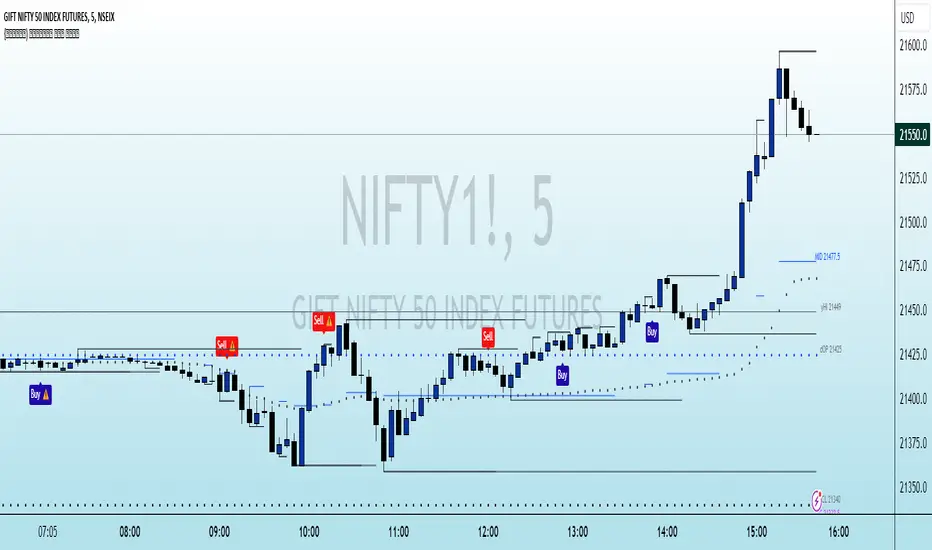
NSDT Pre-Market Breakout LevelsA simple way to identify potential breakouts at the New York market open. This indicator plots the high and low of the New York Pre-Market, providing a great visual of a potential breakout levels.Pine Script®指標由NorthStarDayTrading提供已更新 1414822
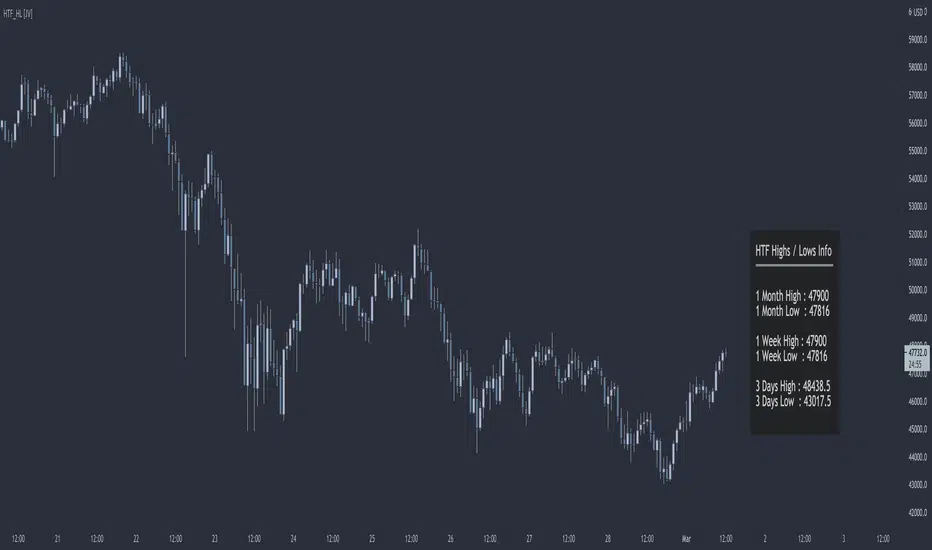
HTF Highs Lows [JV]█ OVERVIEW This script presents a label with an overview of higher timeframe highs and lows. This can be useful information as we all know that price likes to revisit previous highs and lows area, specially on the higher timeframe. █ CONCEPTS This information can be relevant and valuable for various reasons: Finding horizontal Support and Resistance Get a better view on Market Structure Provide some information about Order Flow TrendLines ... █ FEATURES Plots This script provides the option to show information about 3 timeframes Each timeframe can be separately shown or hidden The Y position of the info label can be user defined, based on high or low of the chosen timeframe The X offset of the info label can be adjusted to the user's liking and the chart resolution The label color and text color can be user defined The info label's size can be user defined █ NOTES Caveat The timeframes must be chosen in order of size. Meaning that the highest timeframe should be on top. This is title as such on the info label, but I want to mention it again as it's something to pay attention to. Repainting The question that pops up all the time is: Does it repaint ? I will quote PineCoders on this: We're pretty sure Wilder was not asked very often if RSI repainted. Why? Because it wasn't in fashion—and largely unnecessary—to ask that sort of question in the 80's. Many traders back then used daily charts only, and indicator values were calculated at the day's close, so everybody knew what they were getting. Additionally, indicator values were calculated by generally reputable outfits or traders themselves, so data was pretty reliable. Today, almost anybody can write a simple indicator, and the programming languages used to write them are complex enough for some coders lacking the caution, know-how or ethics of the best professional coders, to get in over their heads and produce code that does not work the way they think it does. Briefly: yes, it repaints and no it does not matter. Simple because we are working with highs and lows on a higher timeframe. So if we get a new high or low within a certain time frame, we want this new high or low to be displayed and, for me, it's not relevant if this information appears when it happens or when the candle closes. Questions & Suggestions Questions, suggestions or even a word of thanks are always welcomed in the comments section. I usually answer within the same day. █ THANKS A word of thanks to, and I hope I am allowed to use hyperlinks here, LonesomeTheBlue for being an inspiration on coding style and his work on arrays in Pine Script and to lmatl for his support, words of advice and letting me borrow his brain now and then.Pine Script®指標由jurlvarg提供3381
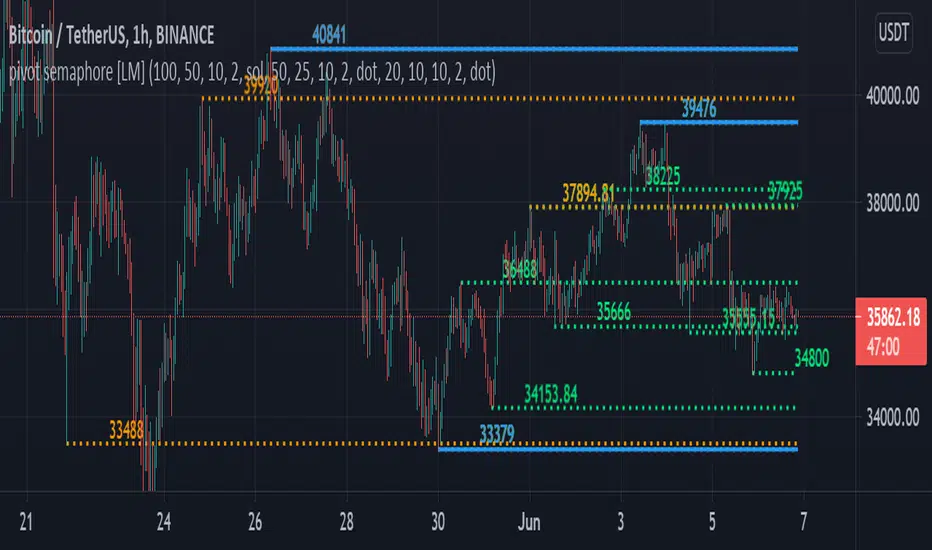
pivot semaphore support&resistance levels [LM]Hello Traders, I would like to introduce you pivot semaphore support&resistance levels. The idea is the same as the zigzag script of mine to spot the importance of support&resistence The Semafor is used to spot future multi-level Supports and Resistance zones. It is also useful to spot HL or LL or HH or LH zones at different Depth settings. The red zones are the extreme places where the market has a higher chance of reversing while the green zones have the lowest setting with lower chances of the market reversal The lines can be extended like so The lines also can just stop extending when price will reach it Enjoy!Pine Script®指標由lmatl提供已更新 1414669
Multi Time Frame Candles with Volume Info / 3DHello Traders, This is my second Multi Time Frame Candles script but with this new one, you will have some new features such volume info, remaining time to close of higher time frame candle and also developed using new features of Pine such array of lines. also I tried to make it 3D for better visualization ;) also it shows new highs/lows / breakouts. I tried to make many things optional, so you can change almost everything using options. What you can change using options: - Higher time frame - Number of Candles - Candle Colors Up/Down - Wick Color - Volume colors Up/Down - Text color of Remaining Time - Shadow Color - Background color - Start bar of the candles (so you can see many higher times frame candles in same window) - 3D effect, by default it's enables but you can disable 3D view Lets see some examples: Remaining time: Breakouts: You can combine different higher time frames: if you don't want 3D view then combining different higher time frames: You can change background color: Enjoy! Pine Script®指標由LonesomeTheBlue提供已更新 103103 5.8 K
Double BB + Multi Ema Supports 2.0 // by Mochero Use this indicator to identify the market trend, possible dynamic support or resistance, and possible reversals or corrections. Take the moving averages (50,75,100,200) as a reference to identify whether the market is bullish or bearish. Use the Parabolic Sar, to identify minor trends. Take as reference the Moving Averages (5,9,15,25) as possible support or dynamic resistance. You can also use a DEMA 9. This indicator marks past Supports and Resistances to have a reference and mark reversal zones. Take the BB as a reference, to identify possible setbacks or trend changes. Added a third BB (optional). -Added 3 types of signals, with RSI, Stoch, DMI. They indicate possible reversals or changes in trends. Suggested values -RSI 4 -Stoch 1 (5,1,1) -Stoch 2 (14,1,1) -DMI (10, 3) Pine Script®指標由cesar9633提供3354
[astropark] Progressive VWAPDearDear Followers, today another awesome Analysis Tool, that you can use in your trading journey: Progressive VWAP ! If you love vwap, you will love this indicator, as it calculates some special "progressive" / "evolving" vwap levels: daily vwap named dvwap 2D vwap named 2dvwap 3D vwap named 3dvwap weekly vwap named wvwap 2W vwap named 2wvwap Monthly vwap named mvwap Quarterly vwap named qvwap Yearly vwap named yvwap You can: choose which progressive vwap to show and which to hide change each line color / thickness / display style (solid or dashed) choose to show or hide labels and change their size Why such indicator should be helpful? How can I use it to do profit? In multiple ways: when a lower timeframe crosses an higher timeframe progressive vwap, you know sentiment is getting bullish and viceversa if the cross is downwards price tends to bounce on such progressive vwaps: the higher the timeframe, the more probably the bounce is as well as the magnitude of the breakout of the level This indicator works on every timeframe, market and pair. As I always say, all tools are great if you use them correctly: this is not the "Holy Grail", so always use proper money and risk management strategies. This is a premium indicator , so send me a private message in order to get access to this script. Pine Script®指標由astropark提供29
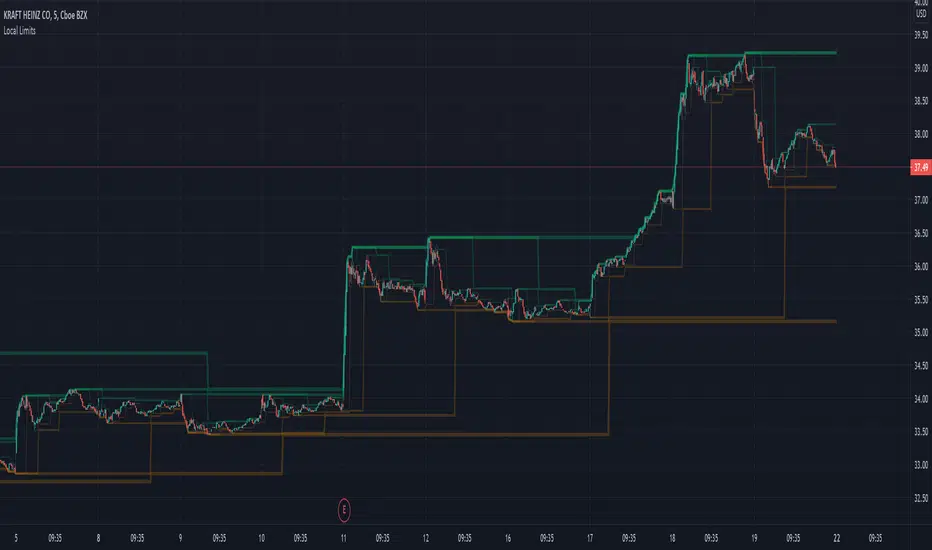
Local LimitsDisplays recent higher highs, lower highs, lower lows, and higher lows as a collection of local limit indicators. In its simplicity is a lot more powerful than might appear at first glance. Does not rely on volatility calculation. Can be linked together to create an objective view of recent support and resistance levels. Makes current trends more visible. Excellent for use as a trailing stop algorithm. Parameters Single Bar Sensitivity: True (default) reacts to individual bars. False only responds to the alignment of 2 bars. Margin (1-5): Adds extra distance from higher lows and lower highs to reduce the sensitivity of broken trends. Single indicators with configurable sources: Local Limit Higher Local Limit LowerPine Script®指標由Electrified提供已更新 328
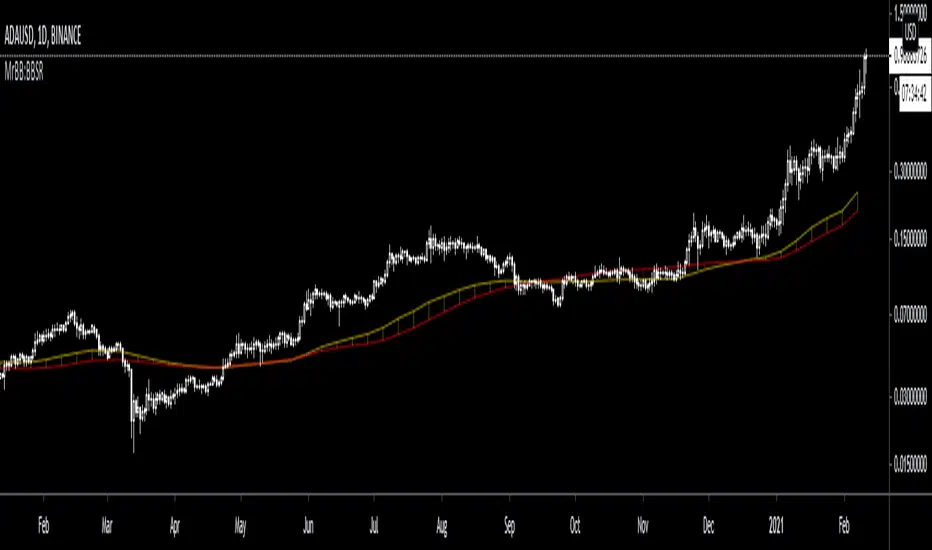
MrBB:BullBear Support BandVery simple and effective S/R band. Created bycombining the weekly 21EMA and weekly 20SMA, it provides strong support/resistance depending on market direction, and works as a basing area for retraces during parabolic (and normal) bull markets.Pine Script®指標由MrBetonBlocks提供66
Support & Resistance LevelsPlots support and resistance levels based on occurrence of fractals. Line width indicates historical significance of the level. Decreasing the proximity multiplier input increases the sensitivity/ increases the frequency of level changes. If price closes above a resistance level, the level becomes a support level and its color on the chart changes to green (& vice-versa). Pine Script®指標由CryptoComrade提供88 1.3 K
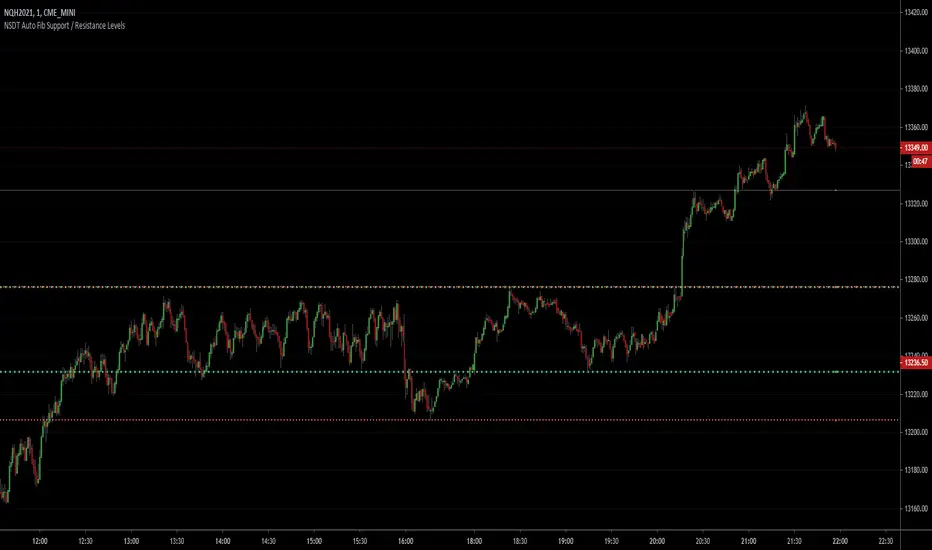
NSDT Auto Fib Support / Resistance LevelsThis script automatically plots support and resistance lines using the fib numbers as the amount of candles to lookback. Each line is colored differently to easily identify the support/resistance pair (i.e. 23%, 38%, 61%, etc..) with the 50% (Green) and 78% (Red) a thicker line. All variables are editable. Added alert capability.Pine Script®指標由NorthStarDayTrading提供77703
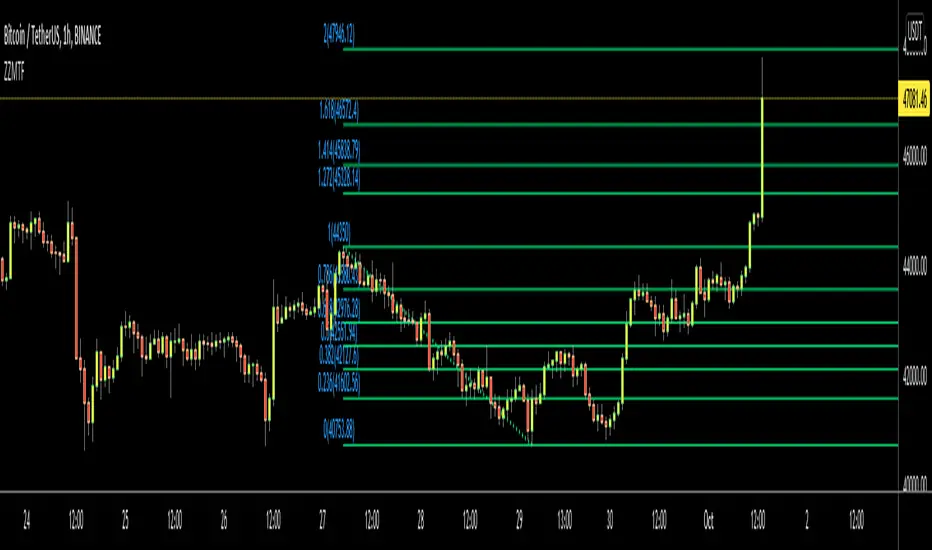
ZigZag Multi Time Frame with Fibonacci RetracementHello Traders, This is ZigZag Multi Time Frame with Fibonacci Retracement script. It calculates the ZigZag using Higher Time Frame, draw Fibonacci Retracement lines and put labels accordingly. I already published Zigzag with Fibonacci Levels script but this one is Multi Time Frame and I didn't want to change/update it. You can set ZigZag Period and Resolution as you wish. Zigzag is calculated using higher time frames (ex: 1day) so you better choose small numbers as Zigzag Period, such 2, 3 etc. you should choose higher time frame wisely, meaning that you should not set 1Day while chart resolution is 1min ;) It draws Fibonacci levels between 0%-100% and If the price goes higher/lower than 100% level than the script draws Fibonacci Levels accordingly. This means it draws Fibonacci levels until this levels get higher/lower than the price. "Show Zig Zag" is not enabled by default, you can enable it if you want to see ZigZag as well. You have options to set Text Color, Line Color, Zigzag Up Color and Zigzag Down Color. You can set the location of the Fibonnaci Levels -> Left or Right You also have option to enable/disable following Fibonnaci Levels: ---> 0.236 ---> 0.382 ---> 0.500 ---> 0.618 ---> 0.786 I added "Colorful Fibonacci Levels" for fun. if you enable it then Fibonacci line colors will be different randomly on each move, see it for yourself :) Some Screenshots: if you enable "Show Zigzag Option": how the script adjust levels automatically: if you set Label Location as "Right": if you enable "Colorful Fibonacci Levels" then Line colors will be changed on each move randomly ;) Enjoy! Pine Script®指標由LonesomeTheBlue提供已更新 9797 9.2 K
Beacon - Anthony Crudele's IndicatorBeacon uses the current volatility of the market based on your trading time frame to determine support and resistance levels, whether a trend is intact or ready to revert back in the range. One of the most difficult things I went through as a trader was determining whether we are in a trend day or if we are in grind up or grind down mode. I created Beacon to give me a simple look at the market to determine what type of environment we are in. I use Bollinger Bands (3 standard deviation) to determine the volatility cycle. Once the BB make peaks I took my Fibonacci Retracement tool and did a retracement from the peak high of the BB to the peak low. I use 70%, 50% and 30% for my support and resistance levels. I use those levels because I tested pretty much every percent level and those percentages averaged the highest performance on all tick charts and time charts. You can use Beacon on whatever time frame or tick chart you are trading on and it will determine that specific volatility cycle. Pine Script®指標由anthonycrudele提供1717 1.1 K
Price Action - Support & Resistance by DGTSᴜᴘᴘᴏʀᴛ ᴀɴᴅ Rᴇꜱɪꜱᴛᴀɴᴄᴇ , is undoubtedly one of the key concepts of technical analysis █ Sᴜᴘᴘᴏʀᴛ ᴀɴᴅ Rᴇꜱɪꜱᴛᴀɴᴄᴇ Dᴇꜰɪɴɪᴛɪᴏɴ Support and Resistance terms are used by traders to refer to price levels on charts that tend to act as barriers, preventing the price of an financial instrument from getting pushed in a certain direction. A support level is a price level where buyers are more aggressive than sellers. This means that the price is more likely to "bounce" off this level rather than break through it. However, once the price has breached this level it is likely to continue falling until meeting another support level. A resistance level is the opposite of a support level. It is where the price tends to find resistance as it rises. Again, this means that the price is more likely to "bounce" off this level rather than break through it. However, once the price has breached this level it is likely to continue rising until meeting another resistance level. A previous support level will sometimes become a resistance level when the price attempts to move back up, and conversely, a resistance level will become a support level as the price temporarily falls back. █ Iᴅᴇɴᴛɪꜰʏɪɴɢ Sᴜᴘᴘᴏʀᴛ ᴀɴᴅ Rᴇꜱɪꜱᴛᴀɴᴄᴇ Support and resistance can come in various forms, and the concept is more difficult to master than it first appears. Identification of key support and resistance levels is an essential ingredient to successful technical analysis. If the price stalls and reverses in the same price area on minimum of two different occasions, then a horizontal line is drawn to show that the market is struggling to move past that area. Those areas are static barriers, one of the most popular forms of support/resistance and are highlighted with horizontal lines. Repeated test , the more often a support/resistance level is "tested" over an extended period of time (touched and bounced off by price), the more significance is given to that specific level High volume , the more buying and selling that has occurred at a particular price level, the stronger the support or resistance level is likely to be Market psychology , plays a major role as traders and investors remember the past and react to changing conditions to anticipate future market movement. Psychological levels , is a price level that significantly affects the price of an underlying financial instrument. Typically, near round numbers often serve as support and resistance The following support and resistance related topics are beyond the scope of this study, so they will be mentioned roughly only as a reference for support and resistance concept Trendlines , Support and resistance levels in trends are dynamic. Throughout an uptrend, levels of support tend to look like a trendline, usually clustering around higher lows. As the price rises, the price where buyers consider the stock to be “too cheap” also changes, which creates new support levels on the way up. The same is also true for resistance levels. In an uptrend, a stock is continuously breaking through perceived resistance levels and making new highs Moving Averages , is a constantly changing line that smooths out past price data while also allowing the trader to identify support and resistance. In the example Notice how the price of the asset finds support at the moving average when the trend is up, and how it acts as resistance when the trend is down The Fibonacci Retracement/Extension tool , is a favorite among many short-term traders because it clearly identifies levels of potential support and resistance Pivot Point Calculations , is another common technical analysis technique, where pivot point is calculated based on the high, low, and closing prices of previous trading session/day and support & resistance levels are projected based on the pivot point, different calculation techniques are available, as presented in this example of an pivot point indicator : PVTvX by DGT █ Tʀᴀᴅɪɴɢ Bᴀꜱᴇᴅ ᴏɴ Sᴜᴘᴘᴏʀᴛ ᴀɴᴅ Rᴇꜱɪꜱᴛᴀɴᴄᴇ Once an area or "zone" of support or resistance has been identified, those price levels can serve as potential entry or exit points because, as a price reaches a point of support or resistance, it will do one of two things—bounce back away from the support or resistance level (trading ranges), or violate the price level and continue in its direction (trading breakouts) —until it hits the next support or resistance level The basic trading method for using support and resistance is to buy near support in uptrends or the parts of ranges or chart patterns where prices are moving up and to sell/sell short near resistance in downtrends or the parts of ranges and chart patterns where prices are moving down. Buying near support or selling near resistance can pay off, but there is no assurance that the support or resistance will hold. Therefore, consider waiting for some confirmation that the market is still respecting that area Trading breakouts, a breakout is a potential trading opportunity that occurs when an asset's price moves above a resistance level or moves below a support level on increasing volume. The first step in trading breakouts is to identify current price trend patterns along with support and resistance levels in order to plan possible entry and exit points. Once the asset trades beyond the price barrier, volatility tends to increase and prices usually trend in the breakout's direction. Breakouts are such an important trading strategy since these setups are the starting point for future volatility increases, large price swings and, in many circumstances, major price trends. When trading breakouts, it is important to consider the underlying asset's support and resistance levels. The more times an asset price has touched these areas, the more valid these levels are and the more important they become. At the same time, the longer these support and resistance levels have been in play, the better the outcome when the asset price finally breaks out. Asset prices will often move slightly further than we expect them to. This doesn't happen all the time, but when it does it is called a false breakout. Therefore it is important to consider waiting for some confirmation while trading breakouts. It’s also popular for traders to sell 50% of their positions at the resistance level, and hold the rest in anticipation of a breakout above resistance █ Pʀɪᴄᴇ Aᴄᴛɪᴏɴ - Sᴜᴘᴘᴏʀᴛ & Rᴇꜱɪꜱᴛᴀɴᴄᴇ ʙʏ DGT Sᴛᴜᴅʏ This experimental study attempts to identify the support and resistance levels. Assumes a simple logic to discover moments where the price is rising or falling consecutively for minimum 3 bars with the condition volume increases on each bar and the last bar’s volume should be bigger than the long term volume moving average. A line will be drawn at the end of the move (highest or lowest, depending on the move direction), the line will be drawn at minimum on the 3rd bar and if condition holds for other consecutive bars the line will switch to 4th, 5th etc bar. Lines will not be deleted so the historical ones will remain and will emphasis the levels significance when they overlap in feature. Strong levels are more likely to hold and cause the price to move in the other direction, whereas the minor levels may only cause the price to pause and keep moving in the same direction. Determining future levels of support and resistance can drastically improve the returns of a short-term investing strategy Bar colors will be painted based on the volume of the specific bar to its long term volume moving average. This will help identifying the support and resistance levels significance and emphasis the sings of breakouts Finally, Volume spikes will be marked on top of the price chart. A high volume usually indicates more interest in the security and the presence of institutional traders. However, a rapidly rising price in an uptrend accompanied by a huge volume may be a sign of exhaustion. Traders usually look for breaks of support and resistance to enter positions. When security break critical levels without volume , you should consider the breakout suspect and prime for a reversal off the highs/lows. Volume spikes are often the result of news-driven events. Volume spike will often lead to sharp reversals since the moves are unsustainable due to the imbalance of supply and demand A good example with many support and resistance concepts observed on a stock chart and detected by the study Settings: Length of volume moving average, where volume moving average is used to detect support and resistance levels, is used as reference to compare with threshold values for volume spikes and colors of the bars Hint, to get more historical lines scrolling chart to left will enable visualization of them. Please note they may appear to much all 500 line limit is used 😉 Special thanks to @HEMANT Telegram user, for his observations and suggestions Disclaimer: Trading success is all about following your trading strategy and the indicators should fit within your trading strategy, and not to be traded upon solely The script is for informational and educational purposes only. Use of the script does not constitute professional and/or financial advice. You alone have the sole responsibility of evaluating the script output and risks associated with the use of the script. In exchange for using the script, you agree not to hold dgtrd TradingView user liable for any possible claim for damages arising from any decision you make based on use of the script Pine Script®指標由dgtrd提供已更新 300300 20.4 K
Bullmarket Support BandThis Indicator displays a Bull Market Support Band for Bitcoin and Ethereum . If the bands cross and the price falls below them it usually means (at least by historical data) that the Bull Market ist coming to an end. Use in weekly timeframe!Pine Script®指標由tgsohenel提供已更新 1111702
{INDYAN} Perfect Buy SellA simple indicator based on candle stick strength, with cpr,vwap and support resistance... search for buy sell signal on 15 min timeframe and wait for second candle to close above/below of signal candle. Cpr pivots would act as support and resistance. Entry should only be based on 15 mins or higher timeframe. 3 and 5 mins timeframe for profit booking. No supertrend or atr used in this indicator. This show how a single candle can give u good trade... Love Indyan * tested on Banknifty and nifty , kindly share ur experiences on other scrips. ThanksPine Script®指標由Indyan提供已更新 3636979
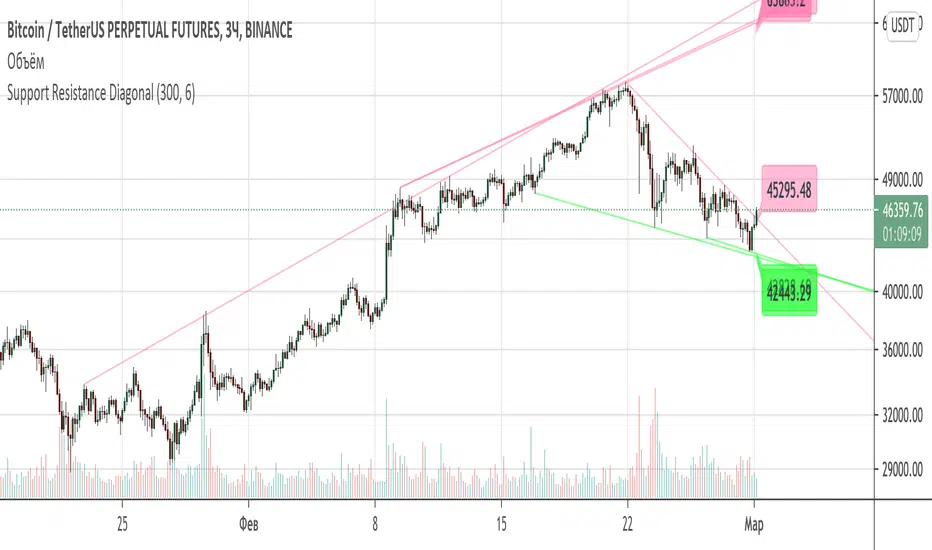
Support Resistance DiagonalClassic diagonal support and resistance based on pivot points. As a result, they form triangles, wedges, channels and other patterns. Realtime update up to 1 second chart.Pine Script®指標由pikusov提供已更新 7676 3.8 K
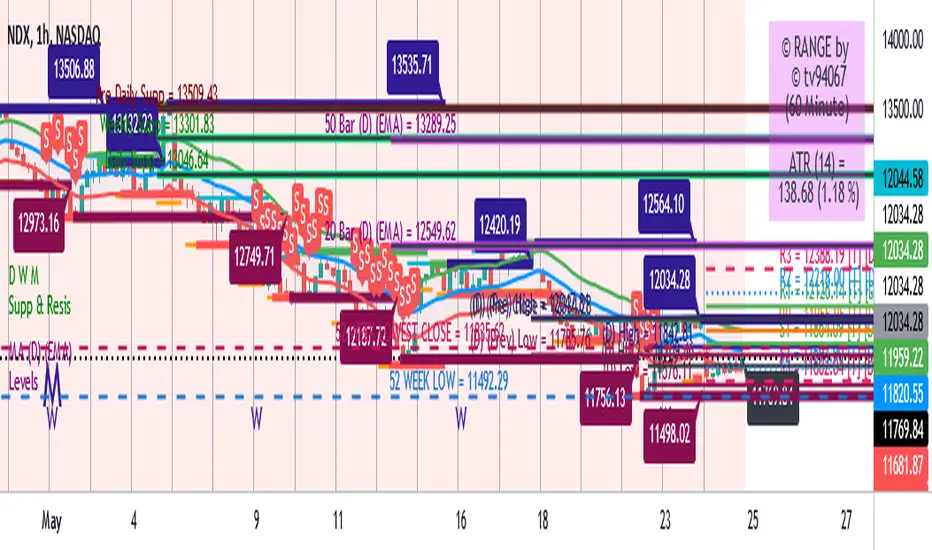
Range support and resistanceWelcome all ========== This script specially is for Kunal Saraogi Senani Traders and beginners. . With this script you can find support and resistance for input range on any time-frame chart. You need not draw line by own. You just input your desired range and this script will do your work automatically. You can adjust range according to your choice. Also have an option to select range source which help you to find support and resistance on the basis of close price or high/low of input range. Default range source is close price. . Latest support and resistance value labels also display on the chart. . To use this script, add to favorite and apply on chart. . Feel free to comment your suggestions. . Thanks all Pine Script®指標由tv94067提供已更新 1919108
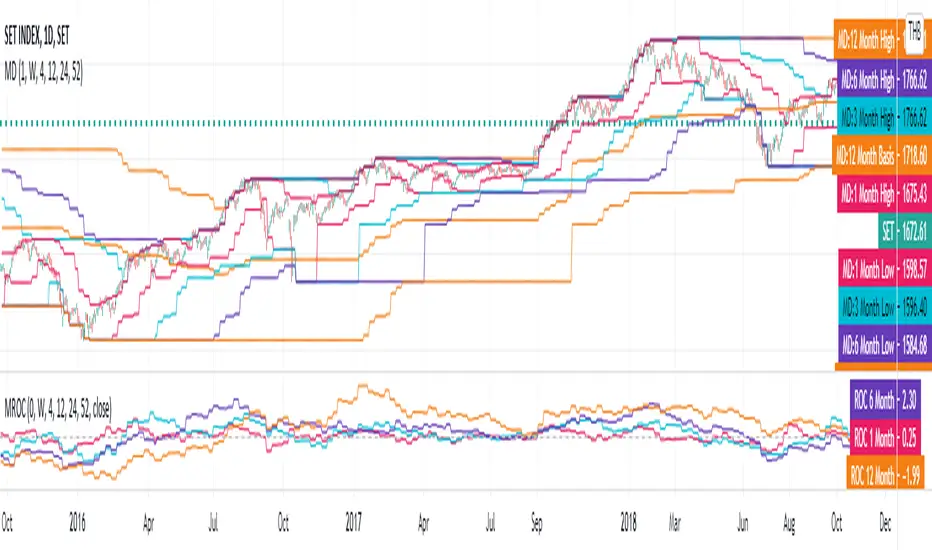
[Jett.][GoldenRush] Market DirectionThis script was created to analyze levels of market trends. This is an indicator that is used to analyze the overall 2 levels. 1.Considering the index's key trends (Strategic Level) 2.Trend Analysis (Tactical Level) To get a big overview of the trend and catch short-term movements. In this indicator, there are 4 levels of momentum measurements. with the default setting Major trends (Strategic Level) 1.We have the highest and lowest prices in the 52-week or 1-year scale. 2.We use the average of the highest and lowest prices(basis of 52-week). can be filtering the overview of the trend 3.As for the trend in 24-week or 6-month. Used to find the direction of the price And helps confirm that a trend is starting to take a certain direction. Sub-level trend (Tactical Level) 1.Price in the level 12-week or 3-month. We use it to calculate the direction of movement in the short term, it is possible that the market will be bullish or bearish in 3-month. 2.And the 12-week or 3-month price is a confirmation of how strongly the short-term price moves in any direction. 3.If there will be a correction of the price base 12 weeks or 3-month price swings always happen first. 4.The 1-month price is the same as the trigger, if the market has a breakout in any way it could mean the start of a short sway. By this indicator Besides being used to measure direction or trend, it can also be used as a significant filter for both support and resistance for short, medium, long term. Jet.T.S. TraderPine Script®指標由Jettstrack提供11