bg_Breakers_orderBlocks_detection (Breakers)Version 0.1
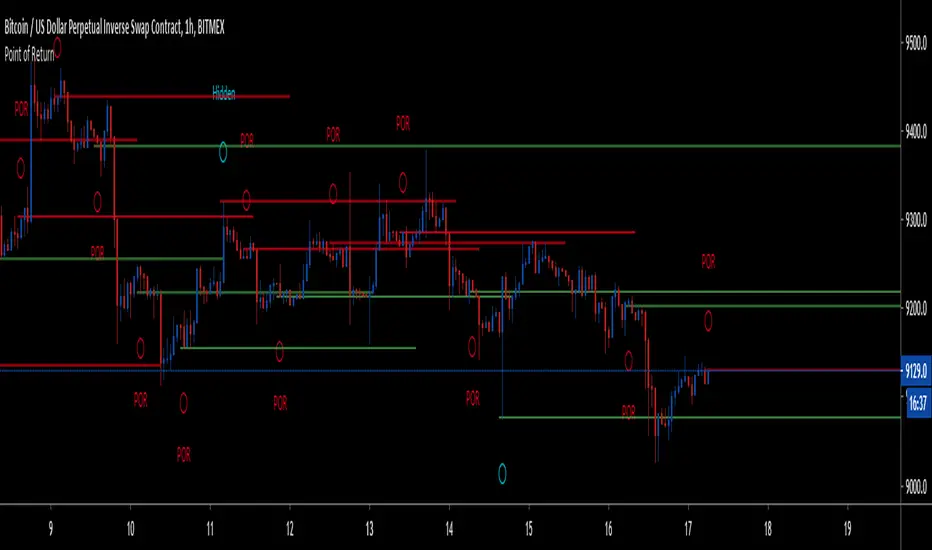
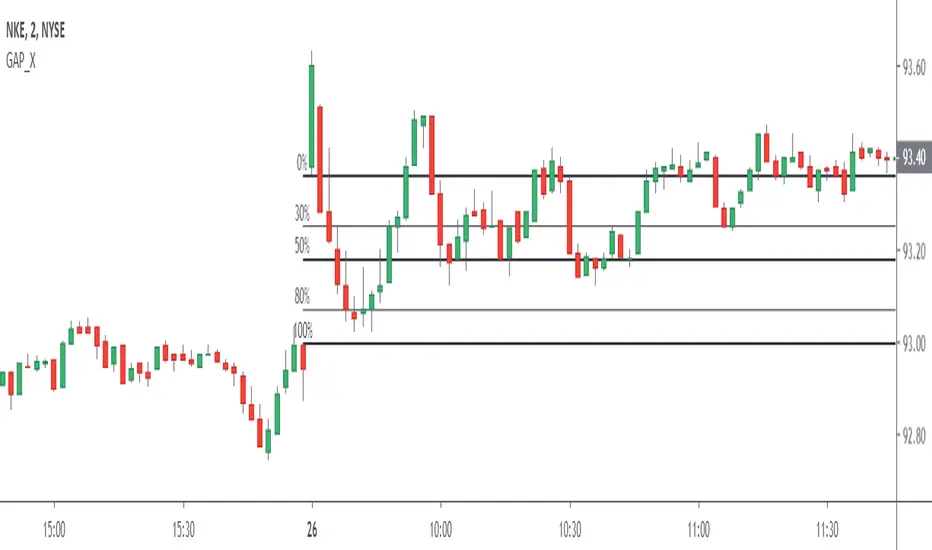
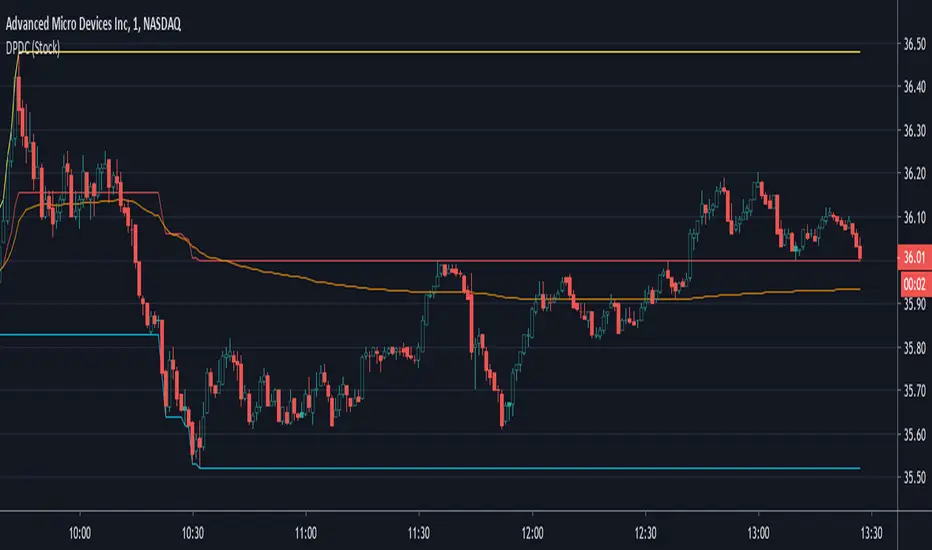
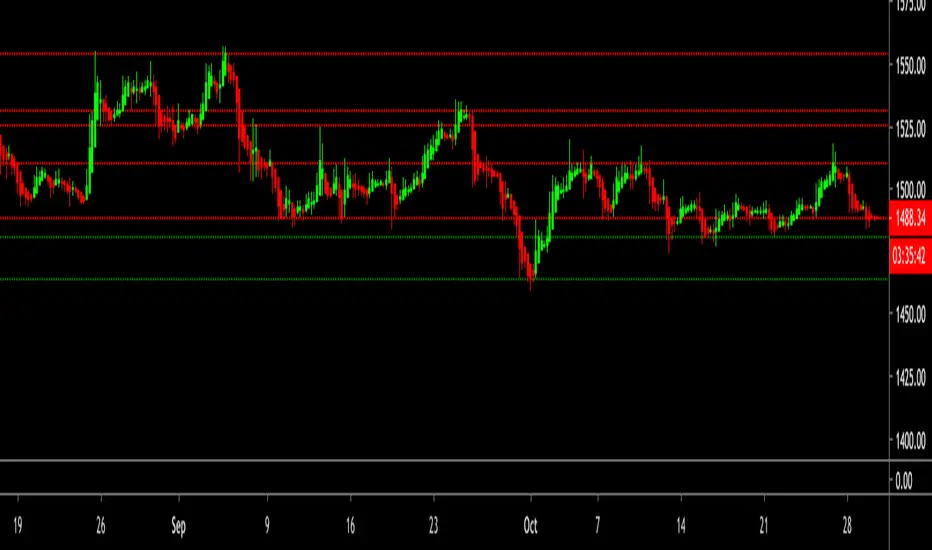
Using Pivots / Swing Point detection, this script plots the final swing candle's body span from top to bottom with an extended horizontal line, with a mid-channel point at 50% between open and close.
Once the trend changes, these zones serve as support and resistance zones, and can help identify breakouts from ranges and probable reversal points moving forward.
To avoid clutter, the script allows you to select a specific date-range (start / end date) which the rule will only apply and plot for.
Other customizable options are the length in bars of the pivot/swing point detection, which is defaulted at 20 bars for both highs and lows.
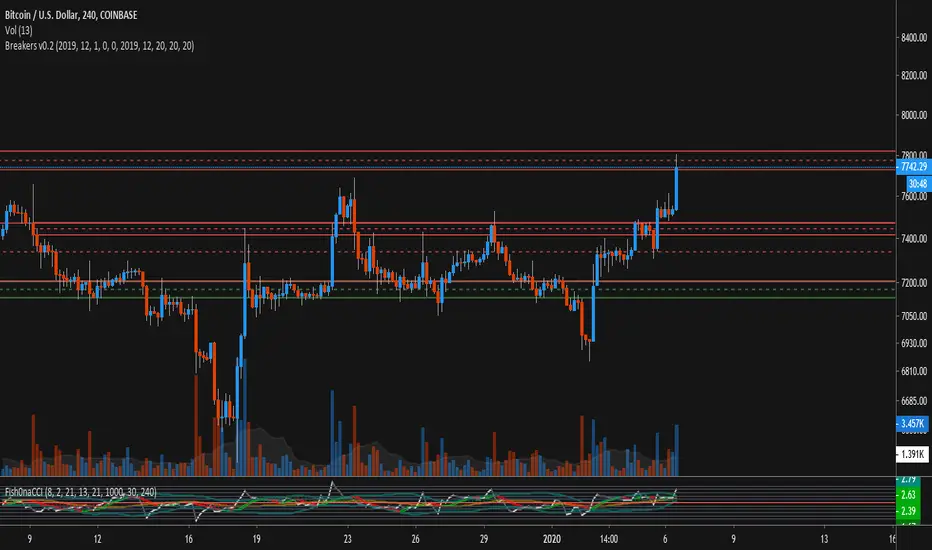
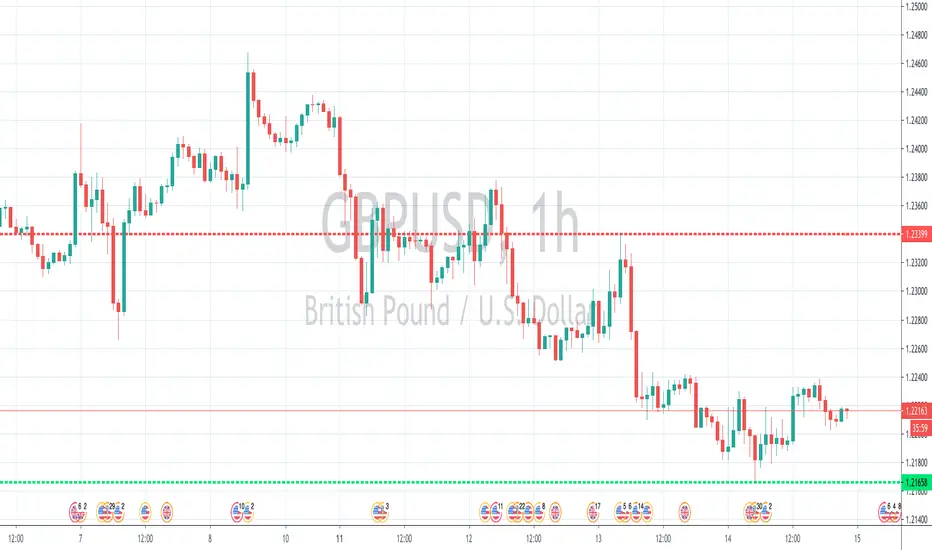
Works best on time-frames 4H, 1D, etc. with some luck to be had in occasionally shorter time-frames as shown above.
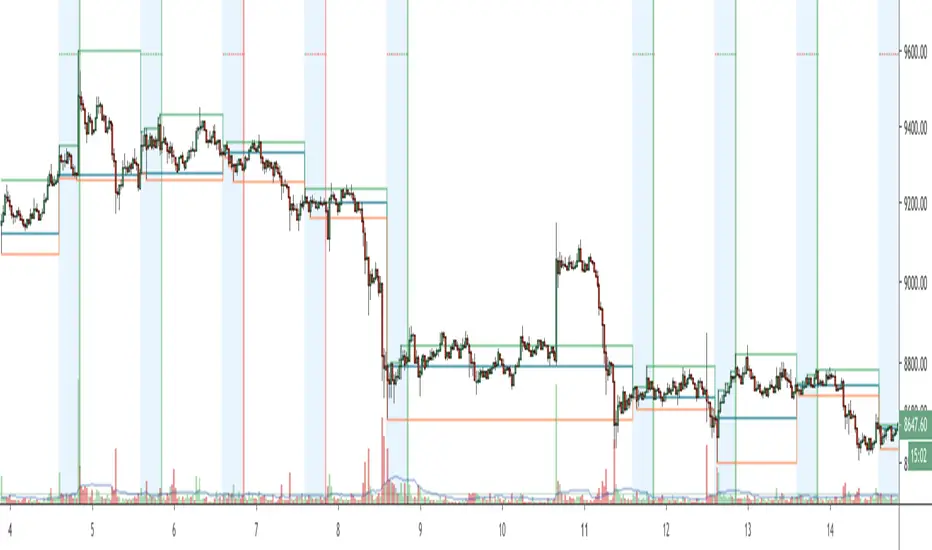
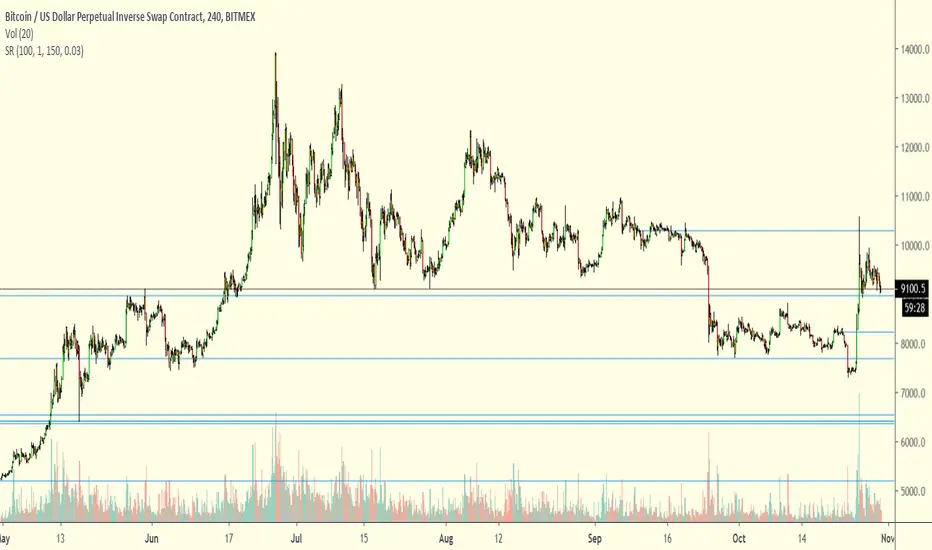
4H:
Pine Script®指標