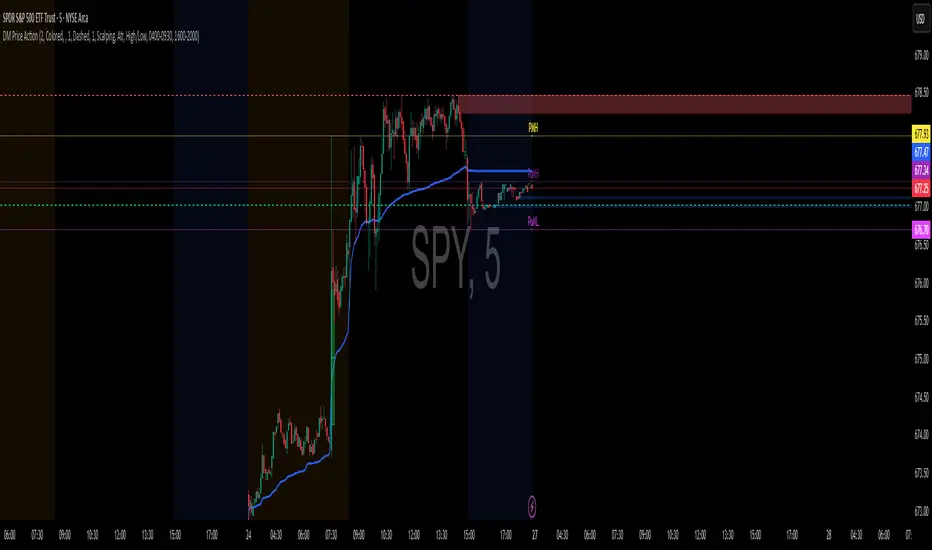
DM Price ActionHere’s a tight, rules-based playbook for trading with your DM Price Action (FVG + S/R + Order Blocks + VWAP + Auto PDH/PDL/PMH/PML). It’s educational, not financial advice—tune to your market & risk.
Core ideas (what each tool does for you)
VWAP → intraday trend/mean.
PDH/PDL → yesterday’s extremes; magnet & reversal/continuation levels.
PMH/PML → premarket extremes; first liquidity tests after the open.
FVG → imbalance zones for continuation entries.
Order Blocks (OBs) → origin of impulses; mitigation/breaks = structure shifts.
S/R → target rails and break alerts.
Setups (long/short mirror)
1) Bias + Pullback (FVG/OB) at Key Level
Bias (need 2+ conditions):
Price above VWAP (bulls) / below VWAP (bears)
Price above PDH/PMH (bulls) or below PDL/PML (bears)
Most recent Swing OB bias in your direction (script updates via crosses)
Entry (bullish example):
Wait for a Bullish FVG to form after we reclaim PMH or PDH.
Prefer FVG overlapping a Bullish OB or sitting just above Support.
Enter on retrace into FVG midline or first bullish reversal candle inside.
Stop: a few ticks below OB low (or FVG bottom, whichever is wider).
Targets:
T1: nearest Resistance or PDH/PMH if not yet tested.
T2: next HTF S/R or fixed 2R–3R.
Manage: to BE at 1R, trail under swing lows or VWAP on trend days.
Bearish mirror: below VWAP, below PDL/PML, Bearish FVG into Bearish OB / Resistance; stop above OB high.
2) Range Break & Retest at PDH/PDL (with OB confirmation)
Context: Price consolidates under PDH (or over PDL).
Trigger: Clean break of PDH/PDL with an OB breakout alert in the break direction.
Entry: On retest of PDH/PDL from the other side, look for a small FVG forming with the move → enter on the pullback.
Stop: beyond the retest wick or the OB edge.
Targets: next S/R, opposing day extreme (e.g., from PDH to PMH/HTF level) or 2R/3R.
3) Premarket Sweep Reversal (open-specific)
Setup: At/near the cash open, price sweeps PMH/PML (wick through) but closes back inside, then a counter-direction OB forms.
Entry: On first FVG in the reversal direction that overlaps that new OB.
Stop: beyond the sweep extreme (PMH/PML).
Targets: VWAP first, then PD midline levels/SR.
Confluence checklist (score ≥3 before clicking)
+1 Above/below VWAP in trade direction
+1 Trading from a PDH/PDL/PMH/PML reaction (reclaim or rejection)
+1 FVG overlaps an OB
+1 Entry at S/R (use the script’s lines)
+1 Fresh zone (recently formed OB/FVG)
+1 Higher-TF structure aligned (e.g., 1H trend)
Take the trade only if score ≥3; size up only at ≥4.
Execution framework (simple & repeatable)
Timeframes: 1H (bias) → 5–15m (execution).
Risk per trade: 0.25–1.0% of account (fixed).
Position size: Size = Risk $ / Stop distance.
Management:
Scale ½ at T1 (nearest SR/PD level), move stop to BE at 1R.
Let runner to T2 (2R–3R) or next PD level.
If VWAP flips against you and closes 2 bars opposite, exit remainder.
Using the inputs (what to tweak)
Order Blocks:
Scalping mode for intraday speed; Day Trade for cleaner swings.
Hide Internal OBs if noise is high; keep Swing OBs for structure.
FVG:
Keep Auto Threshold = ON.
If noisy, plot higher TF FVG (e.g., 15m FVG on 5m chart).
PDH/PDL/PMH/PML:
If chart is cluttered, keep “Show lines only on last bar” ON and labels ON.
Session markets (futures/US equities): use default 0400–0930 premarket; FX/crypto can disable PM lines if irrelevant.
Alerts to set (so you only act on confluence)
Create alerts for:
Bullish/Bearish FVG (execution zones)
Swing/Internal OB Breakout (structure shift)
Support/Resistance Broken (targets/continuation)
(Optional) Crossing PDH/PDL: use TV “Price crossing” with the plotted PDH/PDL values or visually monitor the labels
Workflow: Wait for ≥2 alerts to line up (e.g., Swing OB Breakout + Bullish FVG near PDH), then open the chart and execute the rule set.
Example trade (bullish)
Price reclaims PDH, holds above VWAP.
Bullish FVG prints overlapping a Bullish Internal OB just above PDH.
Limit at FVG midline, stop below OB low.
T1 = next Resistance; T2 = 2R. Move to BE at 1R; trail under new swing lows.
支撐和阻力
Daily Pivot Points LEVELS S-RThis indicator plots daily pivot points based on the previous day’s high, low, and close. It displays the main pivot line, as well as the first levels of support (S1) and resistance (R1), with optional second levels (R2, S2) for additional reference. Ideal for
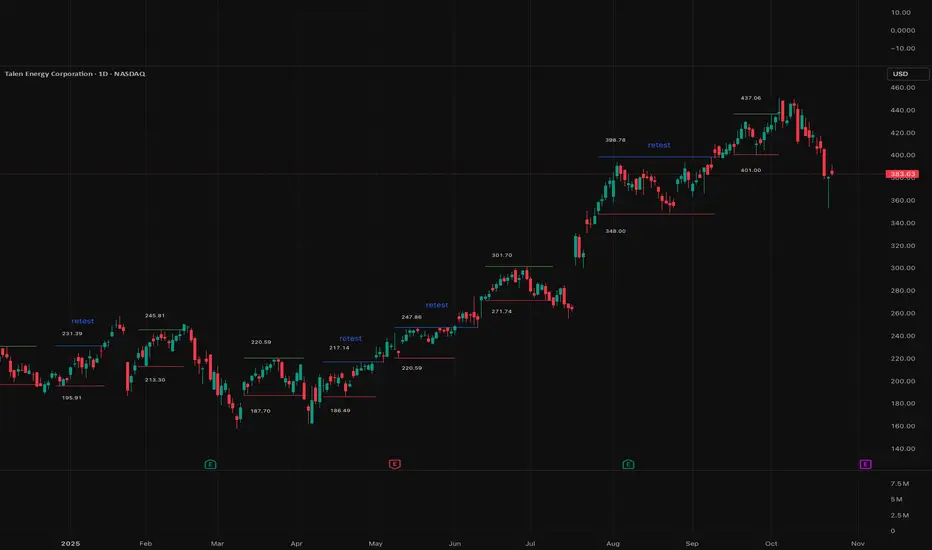
Darvas Lines/Box1. Overview
The Darvas Lines/Box (v1.0) is a dynamic trend following indicator based on the renowned method developed by Nicolas Darvas. It's designed to identify clear price consolidation ranges and detect decisive breakouts, crucial for positional and swing trading strategies.
This indicator automatically draws and adjusts the consolidation ranges, and includes modern enhancements such as Advanced Retest Confirmation and exposed alert conditions, providing reliable signals for monitoring and acting on trend continuations.
2. Core Features
Custom Display Mode (Lines/Box): Allows the user to toggle the visualization between showing just the Breakout Lines (Lines) or displaying the consolidation area with a filled background box (Box).
Source Selection (Wicks/Body): Users can choose whether the box boundaries are defined by the candlestick wicks (price extremes) or the candlestick body (open/close price). This feature is critical for adjusting sensitivity to market noise.
Dynamic Box Drawing: Draws Darvas boxes automatically by tracking price highs and lows based on user-defined parameters (Bars to Define Range, Max Box Height).
Retest Confirmation: Detects if the old resistance/support line functions effectively after a breakout. When a retest is confirmed, the line is extended and its color changes.
Price Labels (Stable Lock): Displays the highest and lowest box prices, fixed to the left outer edge of the box. This ensures stable visibility.
Progress Labels: Visualizes the current line price and the percentage distance to the closing price on the right side of the box, showing progress toward the next breakout.
3. Trading Strategy: How to Use the Indicator
This indicator is primarily used to identify trend initiation and trend continuation signals.
A. Entry Strategy (Breakout)
Long Entry Action: Consider taking a long entry when the price closes above the Upper Line (Green Line), signaled by a BULLISH BREAKOUT alert.
Signal: Use the BULLISH BREAKOUT alert.
Short Entry Action: Consider taking a short entry when the price closes below the Lower Line (Red Line), signaled by a BEARISH BREAKOUT alert.
Signal: Use the BEARISH BREAKOUT alert.
B. Retest Strategy (Add-on/Confirmation)
Action: When the price pulls back to touch the broken line (signaled by RETEST CONFIRMED), this confirms the break's validity.
Alert: The RETEST CONFIRMED alert is triggered at this moment.
C. Risk Management (General)
Stop Loss: The initial stop-loss is typically set just beyond the opposite side of the broken box. As the trend progresses and new boxes form, the lower boundary of the most recently formed box can be used as a trailing stop for managing risk.
4. Setting Parameters
Line Source (Wicks/Body): Crucial for sensitivity. 'Wicks' tracks price extremes; 'Body' tracks stronger close-to-close movements, ignoring noise.
Bars to Define Range: Defines the calculation period (in bars) for the box.
Cooldown Bars After Breakout: Sets the waiting period after a breakout before a new box can start forming.
Retest Lookback Bars (Phase 3): Sets the maximum number of bars to check for a retest during the cooldown phase.
Max Gap for Retest (%): Defines the maximum percentage distance from the line allowed to confirm a retest (Set to Zero (0.0%) for near-touch detection).
Alert Frequency (Breakout): Allows selection between Continuous and Once per Box for breakout signals.
5. Alerts: How to Set Up the Triggers
This indicator exposes several specific conditions to the TradingView alert panel, allowing you to select the exact event you want to monitor.
Step-by-Step Alert Setup:
Open the Alert Panel on the chart.
In the Condition field, select the indicator's name.
In the Alert Condition field, choose the specific event you want to monitor:
1. ANY DARVAS EVENT (Consolidated)
2. BULLISH BREAKOUT (Individual)
3. BEARISH BREAKOUT (Individual)
4. RETEST CONFIRMED (Individual)
In the Trigger field (Frequency), select your preferred native option (e.g., "Once Per Bar Close" or "Once per bar").
Saty ATR Levels w/labelsSatys ATR Levels with labels, Allows for the user to plot ATR levels and see labels with the addition of this script

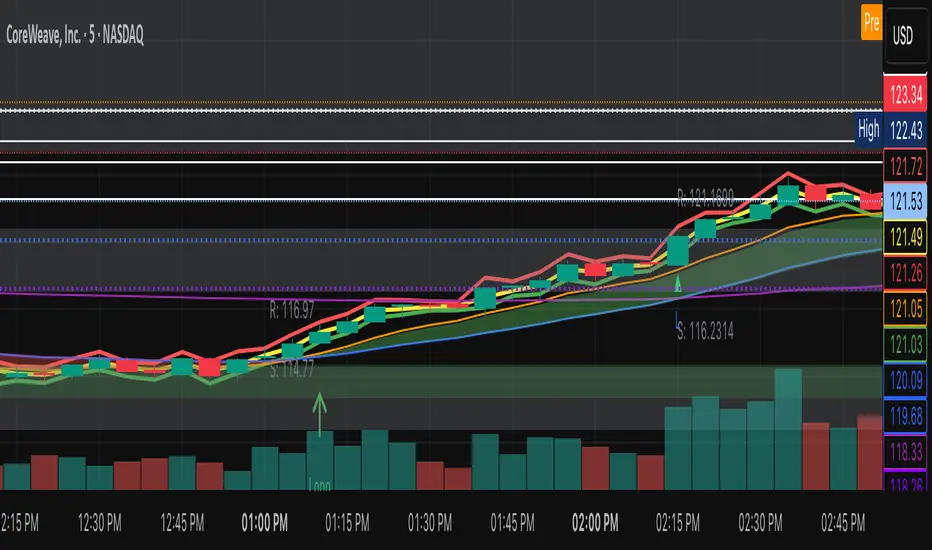
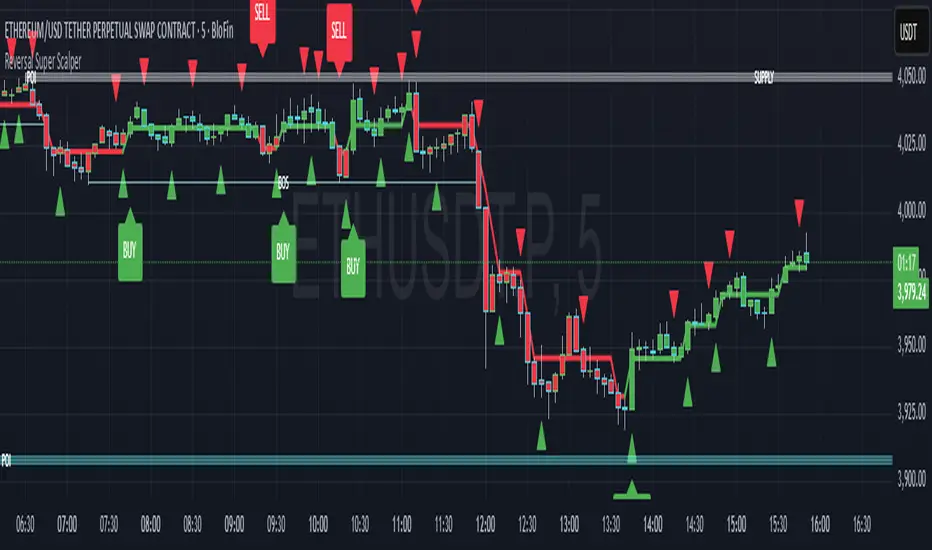
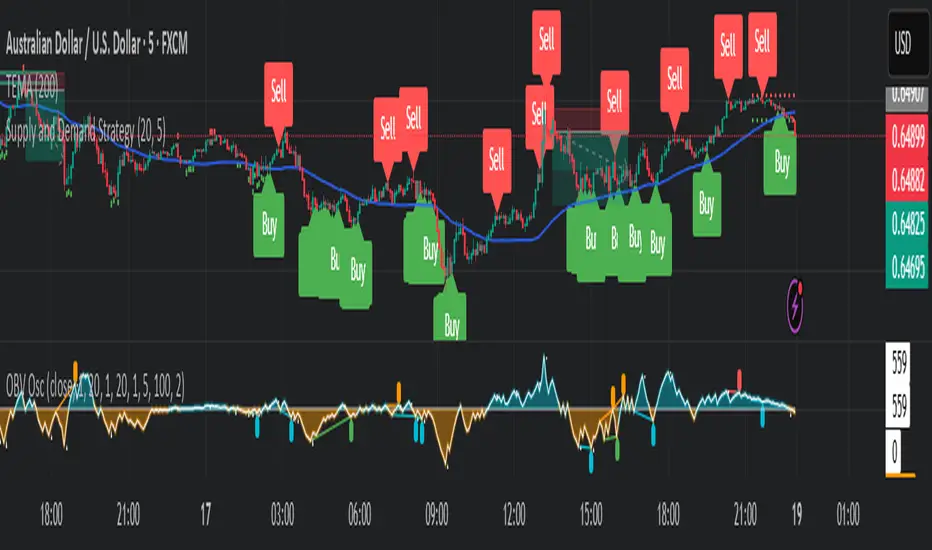
Reversal Super ScalperUsing Grok I've combined several indicators to be used for scalping reversals. My goal is to make sure it alerts me when all of the below conditions have been met.
Indicators that were combined to make this
FluidTrades - SMC Lite indicator - by Pmgjiv
Money Flow Index MTF + Alerts - by DreamsDefined
WaveTrend Filtered Signals (LazyBear Style) - by Uncle_the_shooter
Q-Trend - by tarasenko_
This strategy is for scalping on the 5 minute timeframe.
This way I can set alerts when the price action is close to demand or support levels marked out by the FluidTrades - SMC Lite indicator, the Money Flow Index MTF + Alerts indicator shows oversold if i'm trying to enter a long position or overbought if I'm trying to enter a short position, and the WaveTrend Filtered Signals indicator pops up a buy/sell signal either on the same 5 min candle or two 5 min candles before the Q-Trend buy/sell signal pops up. Once all of these conditions are met, this is when I would enter into a position at the close of the trigger candle from Q-Trend.
Here is an example of how to use this strategy
BUY (LONG) SIGNAL CONDITIONS
Price action must fall back into a level of demand marked out by the FluidTrades indicator.
The candle wick may cross below the demand level, and the candle body may cross slightly below it, as long as the candle does not close below the demand zone.
If any candle closes below the demand level, the buy signal created by the Q-Trend indicator is canceled. The WaveTrend Filtered Signals indicator should generate an alert on the current 5 min candle that Q-trend is generating a buy signal or two 5 min candles before it.
Money Flow Index (MFI) Condition:
On the candle where the buy signal is triggered by the Q-Trend indicator, the MFI must be oversold, with the white line below the 40 level, inside the Red Zone.
When the above conditions are met, enter after the close of the BUY signal trigger candle.
For the short signal it is the opposite of these conditions.
5/15-Min-ORB-Trend-Finder-WiPIndicator Features:
> "Open" flag for each market day.
> Toggleable 5-min and 15-min High/Low markings.
> Horizontal support (red) and resistance (blue) lines.
> EMA-based trend line: green for long/buy, purple for short/sell.
> Recommended to use with my other indicator: Buy-or-Sell-WiP.
Strategy:
> Use with 1-min chart with 5-min High/Low or 5-min chart with 15-min High/Low
> After a breakout, wait for confirmation before placing a trade, which is:
- Two confirming candles (green for long/buy, red for short/sell)
and
- Buy-or-Sell-WiP histogram: green for long/buy, red for short/sell

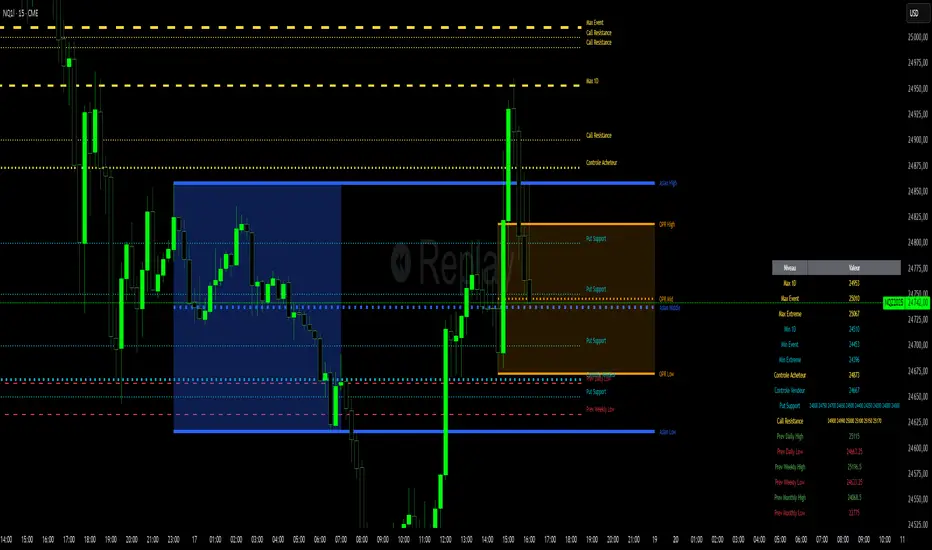
Niv Deal + Previ D W M + OPR + Asian🧭 Indicator Description (English)
Name: Niveaux Dealers + Previous D/W/M Auto + OPR + Asian Session
Platform: TradingView (Pine Script v6)
Type: Multi-module visual indicator for market structure and session ranges
🧩 Overview
This indicator combines three complementary modules to help traders visualize key market levels, opening ranges, and session dynamics — all in one comprehensive tool.
It is designed primarily for index and futures trading (e.g. NQ, ES, DAX), but can be applied to any market or timeframe.
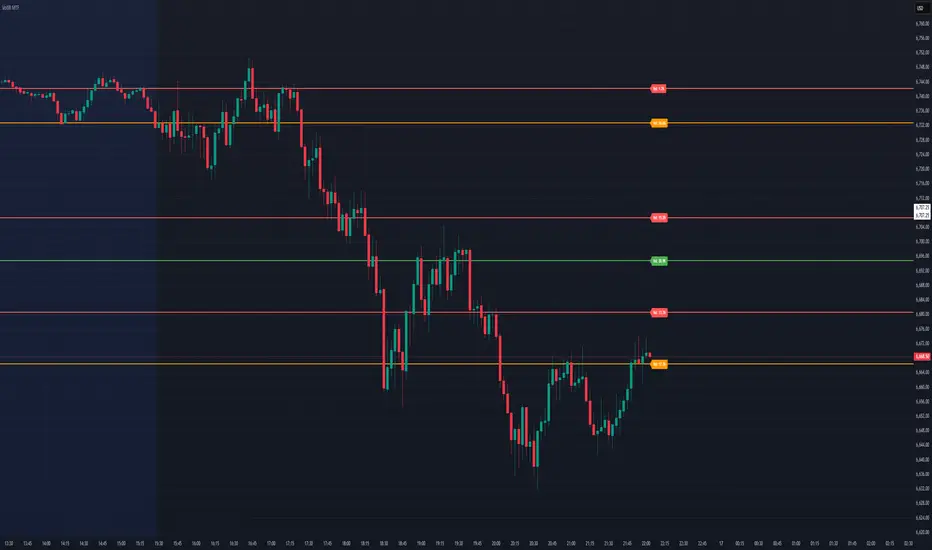
MODULE 1 — Dealers Levels + Previous High/Low (Auto)
This first module automatically extracts and plots custom Dealer Levels and Previous Period Levels.
It can parse manually entered price levels (from a single text input) such as daily max/min, control levels, put supports, and call resistances — then draw horizontal lines and labels on the chart.
Features:
One text input for all dealer levels (easy copy-paste format).
Automatic parsing of prices from text (ignores irrelevant characters).
Groups of levels:
Maxima (Max 1D / Event / Extreme)
Minima (Min 1D / Event / Extreme)
Buyer/Seller Controls
Put Supports and Call Resistances
Independent color, style, and width for each line.
Transparent rectangular labels positioned perfectly on the levels.
Previous Daily, Weekly, and Monthly High/Low levels added automatically.
Optional summary table showing all levels and values in real time.
MODULE 2 — OPR (Opening Price Range)
The second module highlights the Opening Price Range, defined by the first 15 minutes (or any chosen period) of the trading session.
Features:
Fully configurable start and end time (local chart timezone).
Displays:
High, Low, and Midline (median)
Optional rectangle between high/low
Optional labels on each line
Independent color, line style, and thickness.
Works perfectly with non-standard sessions (e.g. 13:30–22:00 UTC for U.S. futures).
Uses local chart time instead of exchange time for intuitive control.
MODULE 3 — Asian Session Range
The third module draws the Asian trading session range, automatically detecting price action between configurable hours (default 17:00 → 01:00).
Features:
Adjustable start and end time (supports overnight sessions).
Plots Asian High, Asian Low, and Asian Middle (mid-range line).
Highlights the Asian box area with semi-transparent color.
Optional labels at the end of each level.
Fully synchronized with the chart’s local timezone (same logic as OPR).
Simple toggle to enable or disable the entire Asian module.
⚙️ Customization & Display
Each module can be toggled independently.
Colors, line styles (solid, dashed, dotted), and thickness are customizable.
Label visibility and extensions (left/right) can be adjusted.
The indicator is lightweight and optimized for real-time performance.
💡 Use Case
Traders can use this multi-module setup to:
Identify dealer reaction zones and institutional levels.
Track previous highs/lows for potential liquidity sweeps.
Monitor session ranges (Opening and Asian) for volatility shifts.
Combine all three perspectives (Dealer, Session, Historical) into one unified view.
Would you like me to rewrite this description in TradingView publication form
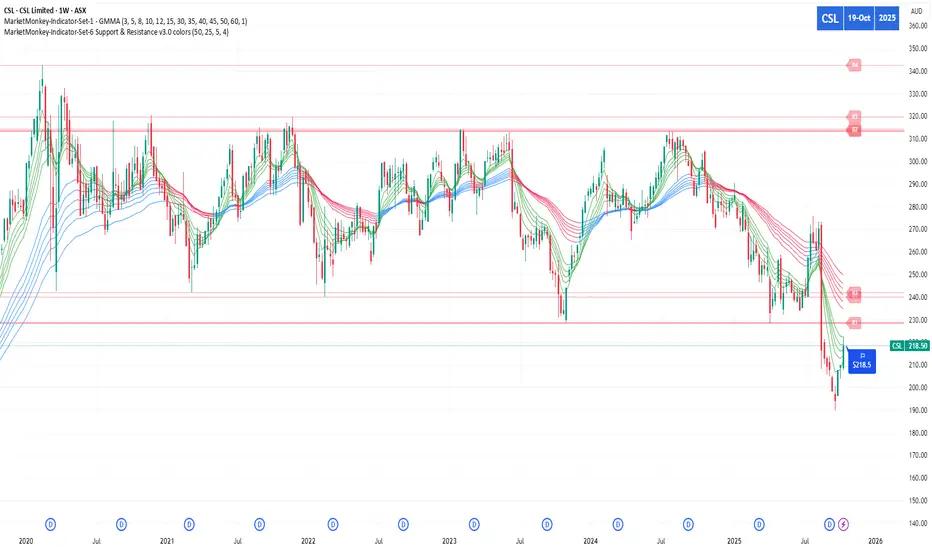
MarketMonkey-Indicator-Set-6 Support & Resistance v3.0 colorsMarketMonkey-Indicator-Set-6 Support & Resistance v3.0 colors
Automatically detects and plots up to four recent support and resistance levels using pivot highs and lows. Lines update dynamically with adaptive colours, highlighting key price zones in real time. Optional R1–R4 and S1–S4 labels keep charts clean yet informative. Ideal for identifying trend reversals, breakout points, and areas where buyers or sellers are likely to act.
________________________________________
🔍 What It Does
The script uses pivot highs and pivot lows to detect recent swing points — the moments where price has clearly turned.
• Resistance levels are drawn at recent pivot highs (red lines).
• Support levels are drawn at recent pivot lows (blue lines).
• Each level automatically updates as new price data forms, keeping your analysis current.
The indicator displays up to four recent resistance and support levels on each side (R1–R4, S1–S4), with labels and colours that adapt to whether the line is above or below current price.
________________________________________
🎨 Features
• Dynamic Detection: Automatically identifies and updates support and resistance using pivot logic.
• Multi-Level Display: Shows up to four most recent highs and lows for a broader market view.
• Customisable Inputs: Adjust the number of bars used to confirm pivots and control how many levels are displayed.
• Colour-Coded Clarity:
o Resistance lines = soft red tone (indicating potential ceiling levels).
o Support lines = soft blue tone (indicating price floors).
• Optional Labels: Toggle on/off “R1–R4” and “S1–S4” tags for quick reference.
• Strong Level Highlighting: The nearest (most recent) levels are drawn thicker for emphasis.
GpPa - Φ Frames (V5.0.1)# GpPa — Φ Frames (V5.0.1)
**What it does**
This tool overlays nine “Phi Frames” on your chart. Each frame builds a dynamic price **box** from the **highest high** and **lowest low** over a user-defined lookback on a fixed timeframe. The boxes help you read structure, extremes, and balance zones across multiple scales in one view. No signals are generated.
**How it works (simple)**
* For every frame, the script requests data at a fixed resolution (e.g., 1D, 610m, 233m, 89m, etc.).
* It scans the last *N* bars at that resolution (your input).
* It draws a box from the start of that window to the current time, bounded by the window’s high and low.
* Optional “Re-Analysis Zone” guides project a vertical line into the future at a user-set offset, giving you a planning marker.
**Frames included**
* **M1** – 1D resolution (default length 258 bars)
* **M2** – 1D resolution (default length 160 bars)
* **M3** – 610-minute resolution (default length 233 bars)
* **M4** – 233-minute resolution (default length 377 bars)
* **M5** – 89-minute resolution (default length 610 bars)
* **M6** – 34-minute resolution (default length 987 bars)
* **M7** – 13-minute resolution (default length 1597 bars)
* **M8** – 5-minute resolution (default length 2584 bars)
* **M9** – 2-minute resolution (default length 4181 bars)
These durations follow a Fibonacci/Φ scheme. Using multiple frames together reveals confluence and nested ranges.
**Inputs & customization**
* **Per-frame controls:**
* *Length (bars)* — lookback window at the frame’s resolution.
* *Show/Hide* — toggle a frame on or off.
* *Color* — box border color.
* **Re-Analysis Zone (M4, M5, M6):**
* *Offset (bars)* — projects a future reference time from the right edge of the box.
* *Show/Hide* and *Color.*
* The line spans slightly above and below the box (+/-10% of its height) for visibility.
**Tips**
* Start with 2–3 frames to reduce clutter. Add more as needed.
* On lower chart resolutions, higher-timeframe boxes will “step” at their own closes.
* Use frames as context for your own entries, risk, and targets.
* Colors are semi-transparent by design so overlaps remain readable.
**Behavior & notes**
* Boxes update intrabar; values settle when the source timeframe closes.
* No alerts, signals, or strategy logic are included.
* Works on any symbol and timeframe.
* Overlay: **true**.
**Disclaimer**
This tool is for educational and informational purposes only. It is not financial advice. Always do your own research and manage risk.
**Credits**
Pine Script™ v6. © thewayofrichie.

Europe Session LinesThis simple script marks the start of the European trading sessions:
08:00 a.m. London trading session
09:00 a.m. Frankfurt trading session
The settings of the lines can be changed. (thickness, colour, type).
It can be used on Futures and CFDs for example for FDAX, FTSE100 but also for GOLD, Silver and EURO- and GBP based FX pairs as supply or demand zone with the change of character trading setup.

Dynamic Volume Based Key Price LevelsDescription
This indicator introduces a volume-based approach to detecting support and resistance zones.
Instead of relying on price swings or pivots, it analyzes where the most trading activity occurred within a selected lookback period, then marks those levels directly on the chart.
The result is a clear visual map of price areas with strong historical participation, which often act as reaction zones in future moves.
How It Works
The script divides the analyzed range into price bins, sums traded volume for each bin, and highlights the strongest levels based on their share of total volume.
It also includes an optional multi-timeframe mode, allowing traders to analyze higher timeframe volume structures on a lower timeframe chart.
Key Features
🔹 Volume-Based Key Levels Detection: Finds statistically meaningful price zones derived from raw volume data.
🔹 Multi-Timeframe Mode: Optionally use higher timeframe volume to identify key market structure levels.
🔹 Visual Customization: Configure colors, line styles, transparency, and label formatting.
🔹 Automatic Ranking: Highlights the strongest to weakest levels using a color gradient.
🔹 Dynamic Updates: Levels adapt automatically as new bars form.
Inputs Overview
Lookback Bars: Number of historical bars used for analysis.
Price Bins: Defines the precision of volume distribution.
Number of Lines: How many key levels to display.
Min Volume %: Filters out less relevant low-volume bins.
Extend Lines: Choose how lines are projected into the future.
Use Higher Timeframe: Pull data from a higher timeframe for broader perspective.
How to Use
Apply the indicator to your chart and adjust the lookback period.
Optionally enable higher timeframe mode for more stable long-term zones.
Observe the horizontal lines — these represent volume-weighted support and resistance areas.
Combine with your existing tools for trend or momentum confirmation.
This tool helps visualize where market participation was strongest, giving traders a clearer view of potential reaction zones for both intraday and swing analysis.
It’s intended as a visual analytical aid, not a signal generator.
⚠️Disclaimer:
This script is provided for educational and informational purposes only. It is not financial advice and should not be considered a recommendation to buy, sell, or hold any financial instrument. Trading involves significant risk of loss and is not suitable for every investor. Users should perform their own due diligence and consult with a licensed financial advisor before making any trading decisions. The author does not guarantee any profits or results from using this script, and assumes no liability for any losses incurred. Use this script at your own risk.
Breakdown or Buyable Dip? Pullback Depth Can HelpAs a common adage says, “the market doesn’t move in a straight line.” But when prices have fallen, it’s not always clear whether buying makes sense. That’s where today’s script may help.
Most traditional indicators judge movement based on price. That’s obviously important, but time can also be helpful. After all, there’s a big difference between probing a low from 2-3 weeks ago versus a low from months or even years in the past.
Pullback Depth clearly illustrates this by answering the question: “Today’s low is the lowest in how many bars?”
The resulting integer is plotted in a simple histogram. Values are always negative because bars with higher absolute values (meaning more negative, or further below zero) are potentially more bearish.
The study also has a maximum lookback period to avoid overwhelming the study with too many bars. Its default setting of 125 bars includes enough history to illustrate the trend.
The stock market’s recent run has seen only shallow pullbacks. Most dips have probed 1-2 weeks in the past, while Friday’s selloff only turned back the clock a month.
Consider two other previous moments.
First, the great bull run of 1995 saw only shallow pullbacks. (None exceeded 50 days.):
In contrast, early 2022 saw the S&P 500 test levels more than 100 candles into the past. It soon fell into an official “bear market:”
TradeStation has, for decades, advanced the trading industry, providing access to stocks, options and futures. If you're born to trade, we could be for you. See our Overview for more.
Past performance, whether actual or indicated by historical tests of strategies, is no guarantee of future performance or success. There is a possibility that you may sustain a loss equal to or greater than your entire investment regardless of which asset class you trade (equities, options or futures); therefore, you should not invest or risk money that you cannot afford to lose. Online trading is not suitable for all investors. View the document titled Characteristics and Risks of Standardized Options at www.TradeStation.com . Before trading any asset class, customers must read the relevant risk disclosure statements on www.TradeStation.com . System access and trade placement and execution may be delayed or fail due to market volatility and volume, quote delays, system and software errors, Internet traffic, outages and other factors.
Securities and futures trading is offered to self-directed customers by TradeStation Securities, Inc., a broker-dealer registered with the Securities and Exchange Commission and a futures commission merchant licensed with the Commodity Futures Trading Commission). TradeStation Securities is a member of the Financial Industry Regulatory Authority, the National Futures Association, and a number of exchanges.
TradeStation Securities, Inc. and TradeStation Technologies, Inc. are each wholly owned subsidiaries of TradeStation Group, Inc., both operating, and providing products and services, under the TradeStation brand and trademark. When applying for, or purchasing, accounts, subscriptions, products and services, it is important that you know which company you will be dealing with. Visit www.TradeStation.com for further important information explaining what this means.

Tweezer & Kangaroo Zones [WavesUnchained]Tweezer & Kangaroo Zones
Pattern Recognition with Supply/Demand Zones
Indicator that detects tweezer and kangaroo tail (pin bar) reversal patterns and creates supply and demand zones. Includes volume validation, trend context, and confluence scoring.
What You See on Your Chart
Pattern Labels:
"T" (Red) - Tweezer Top detected above price → Bearish reversal signal
"T" (Green) - Tweezer Bottom detected below price → Bullish reversal signal
"K" (Red) - Kangaroo Bear (Pin Bar rejection from top) → Bearish signal
"K" (Green) - Kangaroo Bull (Pin Bar rejection from bottom) → Bullish signal
Label Colors Indicate Pattern Strength:
Dark Green/Red - Strong pattern (score ≥8.0)
Medium Green/Red - Good pattern (score ≥6.0)
Light Green/Red - Valid pattern (score <6.0)
Zone Boxes:
Red Boxes - Supply Zones (resistance, potential short areas)
Green Boxes - Demand Zones (support, potential long areas)
White Border - Active zone (fresh, not tested yet)
Gray Border - Inactive zone (expired or invalidated)
Pattern Detection
Tweezer Patterns (Classic Double-Top/Bottom):
Flexible Lookback - Detects patterns up to 3 bars apart (not just consecutive)
Precision Matching - 0.2% level tolerance for high-quality signals
Wick Similarity Check - Both candles must show similar rejection wicks
Volume Validation - Second candle requires elevated volume (0.8x average)
Pattern Strength Score - 0-1 quality rating based on level match + wick similarity
Optional Trend Context - Can require trend alignment (default: OFF for more signals)
Kangaroo Tail / Pin Bar Patterns:
No Pivot Delay - Instant detection without waiting for pivot confirmation
Body Position Check - Body must be at candle extremes (30% tolerance)
Volume Spike - Rejection must occur with volume (0.9x average)
Rejection Strength - Scores based on wick length (0.5-0.9 of range)
Optional Trend Context - Bearish in uptrends, Bullish in downtrends (default: OFF)
Zone Management
Auto-Created Zones - Every valid pattern creates a supply/demand zone
Overlap Prevention - Zones too close together (50% overlap) are not duplicated
Lifetime Control - Zones expire after 400 bars (configurable)
Smart Invalidation - Zones invalidate when price closes through them
Styling Options - Choose between Solid, Dashed, or Dotted borders
Border Width - 2px width for better visibility
Confluence Scoring System
Multi-factor confluence scoring (0-10 scale) with configurable weights:
Regime (EMA+HTF) - Trend alignment across timeframes (Weight: 2.0)
HTF Stack - Multi-timeframe trend confluence (Weight: 3.0)
Structure - Higher lows / Lower highs confirmation (Weight: 1.0)
Relative Volume - Volume surge validation (Weight: 1.0)
Chop Advantage - Favorable market conditions (Weight: 1.0)
Zone Thinness - Tight zones = better R/R (Weight: 1.0)
Supertrend - Trend indicator alignment (Weight: 1.0)
MOST - Moving Stop alignment (Weight: 1.0)
Pattern Strength - Quality of detected pattern (Weight: 1.5)
Zone Retest Signals
Signals generated when zones are retested:
BUY Signal - Price retests demand zone from above (score ≥4.5)
SELL Signal - Price retests supply zone from below (score ≥5.5)
Normalized Score - Displayed as 0-10 for easy interpretation
Optional Trend Gate - Require trend alignment for signals (default: OFF)
Alert Ready - Built-in alertconditions for automation
Additional Features
Auto-Threshold Tuning - Adapts to ATR and Choppiness automatically
Session Profiles - Different settings for RTH vs ETH sessions
Organized Settings - 15+ input groups for easy configuration
Optional Panels - HTF Stack overview and performance metrics (default: OFF)
Data Exports - Hidden plots for strategy/library integration
RTA Health Monitoring - Built-in performance tracking
Setup & Configuration
Quick Start:
1. Apply indicator to any timeframe
2. Patterns and zones appear automatically
3. Adjust pattern detection sensitivity if needed
4. Configure zone styling (Solid/Dashed/Dotted)
5. Set up alerts for zone retests
Key Settings to Adjust:
Pattern Detection:
• Min RelVolume: Lower = more signals (0.8 Tweezer, 0.9 Kangaroo)
• Require trend context: Enable for stricter, higher-quality patterns
• Check wick similarity: Ensures proper rejection structure
Zone Management:
• Zone lifetime: How long zones remain active (default: 400 bars)
• Invalidate on close-through: Remove zones when price breaks through
• Max overlap: Prevent duplicate zones (default: 50%)
Scoring:
• Min Score BUY/SELL: Higher = fewer but better signals (default: 4.5/5.5)
• Component weights: Customize what factors matter most
• Signals require trend gate: OFF = more signals, ON = higher quality
Visual Customization
Zone Colors - Light red/green with 85% transparency (non-intrusive)
Border Styles - Solid, Dashed, or Dotted
Label Intensity - Darker greens for better readability
Clean Charts - All panels OFF by default
Understanding the Zones
Supply Zones (Red):
Created from bearish patterns (Tweezer Tops, Kangaroo Bears). Price made a high attempt to push higher, but was rejected. These become resistance areas where sellers may step in again.
Demand Zones (Green):
Created from bullish patterns (Tweezer Bottoms, Kangaroo Bulls). Price made a low with strong rejection. These become support areas where buyers may step in again.
Zone Quality Indicators:
• White border = Fresh zone, not tested yet
• Gray border = Zone expired or invalidated
• Thin zones (tight range) = Better risk/reward ratio
• Thick zones = Less precise, wider stop required
Trading Applications
Reversal Trading - Enter at pattern detection with tight stops
Zone Retest Trading - Wait for retests of established zones
Trend Confluence - Trade only when patterns align with trend
Risk Management - Use zone boundaries for stop placement
Target Setting - Opposite zones become profit targets
Pro Tips
Best signals occur when pattern + zone retest + trend all align
Lower timeframes = more signals but more noise
Higher timeframes = fewer but more reliable signals
Start with default settings, adjust based on your market
Combine with other analysis (structure, key levels, etc.)
Use alerts to avoid staring at charts all day
Important Notes
Not all patterns will lead to successful trades
Use proper risk management and position sizing
Patterns work best in trending or range-bound markets
Very choppy conditions may produce lower-quality signals
Always confirm with your own analysis before trading
Technical Specifications
• Pine Script v6
• RTA-Core integration
• RTA Core Library integration
• Maximum 200 boxes, 500 labels
• Auto-tuning based on ATR and Choppiness
• Session-aware threshold adjustments
• Memory-optimized zone management
What's Included
Tweezer Top/Bottom detection
Kangaroo Tail / Pin Bar detection
Automatic supply/demand zone creation
Volume validation system
Pattern strength scoring
Zone retest signals
Multi-factor confluence scoring
Optional HTF Stack panel
Optional performance metrics
Session profile support
Auto-threshold tuning
Alert conditions
Data exports for strategies
Author Waves Unchained
Version 1.0
Status Public Indicator
Summary
Reversal pattern detection with zone management, volume validation, and confluence scoring for tweezer and kangaroo tail patterns.
---
Disclaimer: This indicator is for educational and informational purposes only. Trading involves risk. Past performance does not guarantee future results. Always practice proper risk management.

ICT Levels Breach Scanner (12M Timeframe)Detects and scans for breaches of key Inner Circle Trader (ICT) concepts on the yearly (12M) chart: Swing Lows (3-bar wick pivots), Rejection Blocks (3-bar body pivots), Fair Value Gaps (3-bar inefficiencies), and Volume Imbalances (bullish body gaps ≥0.15%, unmitigated).
Features:
Tracks active levels with arrays for real-time breach detection (price low below any level triggers alert).
Visuals: Blue solid lines (Swing Lows), orange dashed (Rejection Blocks), purple dotted (FVGs), green boxes (VIs)—all extending right.
Red triangle + bgcolor alert on breach bar; built-in alertcondition for notifications.
Optimized for Pine Screener: Filter stocks (e.g., US exchanges) showing symbols where price has traded below these levels on the latest 12M bar.
Usage: Apply to a 12M chart for viz, or add to Screener > Pine tab for multi-symbol scans. Customize gap % or add bearish variants via inputs. Ideal for spotting potential support in long-term trends.
ICT-inspired; test on liquid stocks like AAPL/TSLA. Not financial advice.

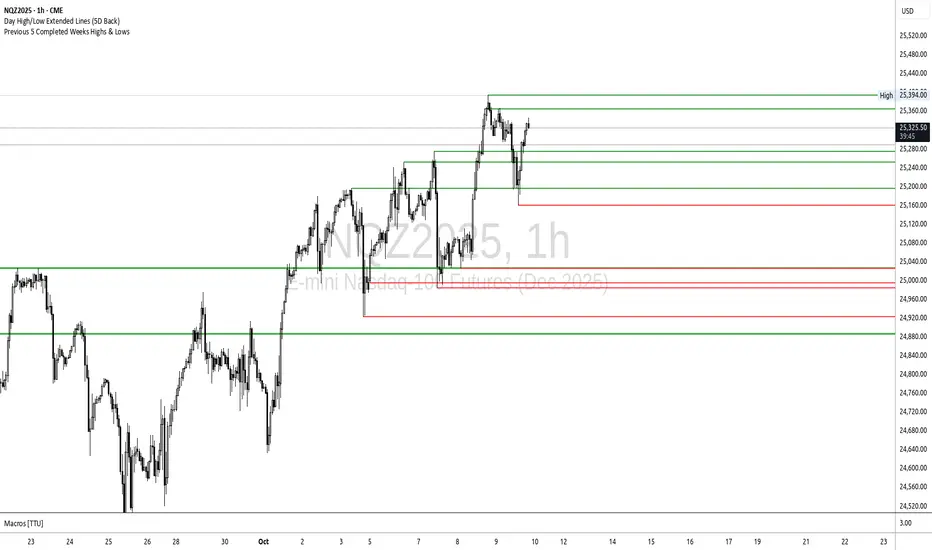
Key Session Levels | Highs, Lows, OpensOverview
Designed for scalping and intraday trading on ES, NQ, and other futures markets that trade around the clock, this indicator automatically plots key support/resistance levels:
Session opens
Session highs
Session lows
Overnight highs
Overnight lows
Session Definitions (America/New_York Time)
Session (18:00 - 16:59 ET)
Tracks complete trading cycle
Plots: High, Low
Represents true daily extremes of each session
Overnight Session (18:00 - 9:30 ET)
Captures Asian and European session price action
Plots: Open, High, Low
These levels can act as support/resistance during the NY session
NY Session (9:30 - 16:59 ET)
Optional background highlight for regular trading hours
Helps visually distinguish active NY session from overnight action
Key Features
Flexible Extension Modes
Same Day: Lines end at session close
Next Day: Lines extend through the following session
Full Chart: Lines extend indefinitely to the right
Smart Line Management
Optional extension of overnight levels through NY session
Control how many historical sessions to display (1-250)
Automatic cleanup of old lines
Full Customization
Individual color control for each level
Line style options (solid, dotted, dashed)
Line width adjustment (1px-4px)
Show/hide any level independently
Common Use Cases
Support/Resistance
Breakout/Break & Retest
Strategy
Wait for price to reach a key level
Use Level 2 data to determine who's in control at the level (e.g. aggressive buyers vs. passive sellers) *this requires third-party software and a live data feed
Enter long/short WITH institutional players, identified via Level 2 data
Target areas/levels where the market may reverse
Best Timeframes
Works on any intraday timeframe, optimized for: 1m, 5m, 15m, 30m, 1H
Notes
All times are in America/New_York (Eastern Time)
Requires intraday timeframe to detect specific session times
Lines are semi-transparent by default for better chart visibility

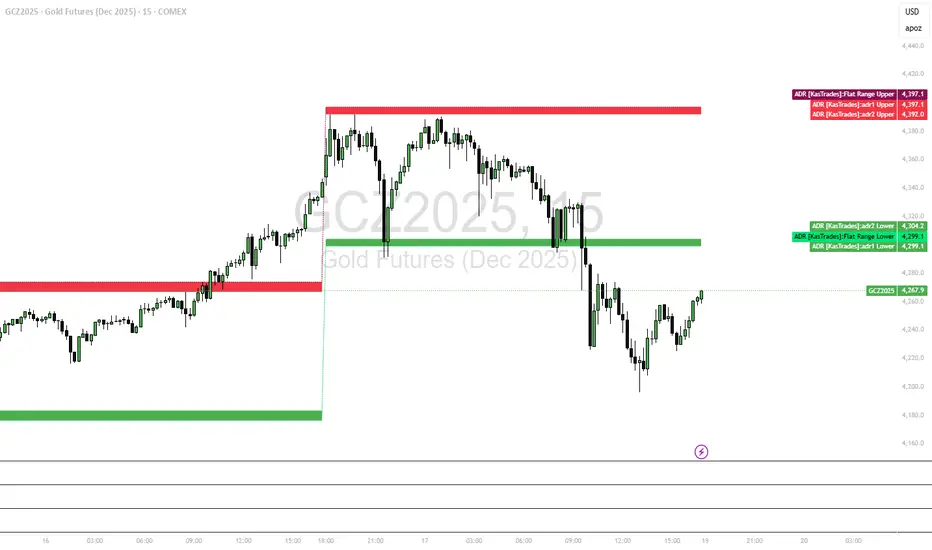
ADR - Average Daily Range [KasTrades]This is an Average Daily Range (ADR) indicator.
There are two settings for ADR:
Two Look back period ADR range (e.g. 7 and 14 days)
One Look back period ADR (e.g. 5 days only)
Two day ADR ranges are typically used in equities and index futures whereas one day ADR is typically used in forex.
The opening time by default is 17:00 New York (Eastern) time. The ranges are always calculated from the opening price of the first bar on the respected timeframe.

ADR [KasTrades]This ADR indicator has 2 options: a Range of ADR, such as 7 and 14 which is typically used for indexes, index futures and equities, or a single ADR such as a 5 day which is typically used for forex.
The session start time is 17:00 ET (NY Time) by default, this is adjustable.
You can adjust the ADR days to different ranges such as 5 and 10, or a single ADR day such as 7.
Colors of the ADR high and low are also adjustable.
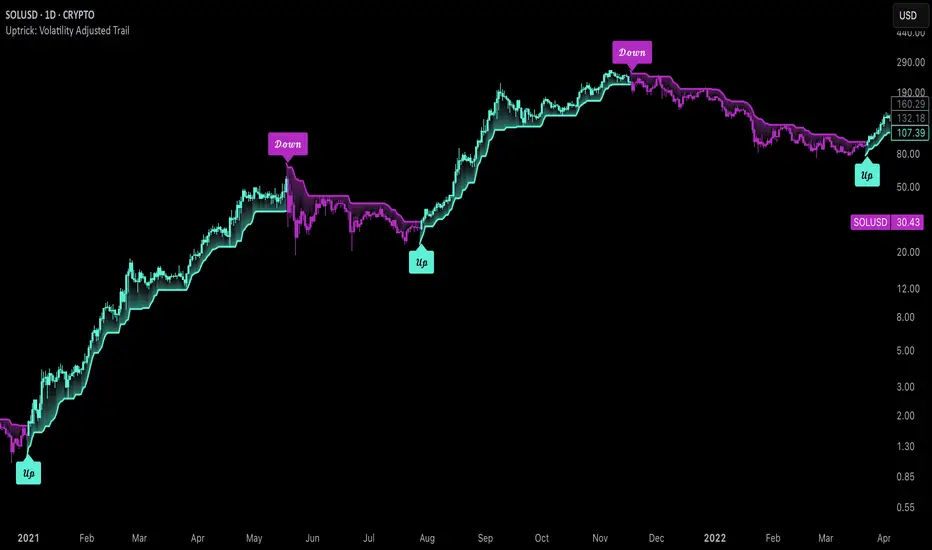
Uptrick: Volatility Adjusted TrailIntroduction
The "Uptrick: Volatility Adjusted Trail" is a dynamic trailing band indicator. It adapts in real time to changing market conditions by adjusting both to volatility and trend consistency. Inspired by Supertrend-style logic, it enhances traditional approaches by introducing adaptive mechanisms for more context-sensitive behavior in both trending and consolidating environments.
Overview
This indicator combines an exponential moving average (EMA) as its basis with an Average True Range (ATR)-derived multiplier that adjusts dynamically. Unlike fixed-multiplier tools, this indicator modifies its band distances in real time according to volatility expansion and trend persistence. The result is a trailing system that adapts to the prevailing market regime, providing traders with clearer signals for trend bias, stop placement, and potential momentum shifts.
Originality
The script’s originality lies in its multi-layered approach to trail calculation. It introduces a real-time ATR multiplier adjustment driven by two factors: a volatility expansion ratio and a trend persistence model. The expansion ratio compares the current ATR to its moving average, making the indicator more sensitive during volatile conditions and less sensitive during quieter periods. The trend persistence model assesses directional consistency to widen the bands during sustained trends. This dual adjustment method creates a system that evolves with market behavior, making it more responsive and adaptive than static-band or fixed-multiplier alternatives.
Components & Inspiration
This indicator was designed with specific components that work together:
Exponential Moving Average (EMA): Chosen as the central baseline because it responds faster to recent price changes than a simple moving average, providing a more current reference for trailing bands.
Average True Range (ATR): Used as the volatility measure because it accounts for both intraday and gap movement, making it a robust and widely accepted standard for market volatility.
Dynamic Multiplier: The multiplier is adjusted by both volatility expansion and trend persistence to produce bands that tighten during low volatility and widen during consistent trends. This combination was chosen to give the indicator the ability to self-regulate across different market regimes.
Trend Persistence Model: Integrated to assess directional consistency, ensuring the bands expand during strong trends, which can prevent premature stop-outs.
Flip Confirmation Logic: Added to filter out noise by requiring multiple bar closes beyond a band before confirming a state change, reducing false reversals.
For inspiration, the indicator draws on the core idea behind Supertrend—using a baseline and volatility-derived bands to define trailing stop levels. However, while Supertrend uses a fixed ATR multiplier, this indicator introduces a dynamic multiplier system and persistence weighting, making it more adaptive and suited for varying conditions.
Inputs and Parameters
Basis EMA Length
Defines the period for the EMA that serves as the core price reference.
ATR Length
Sets the lookback period for the Average True Range calculation used in band spacing.
Base ATR Mult
The base multiplier applied to ATR before adjustments. Forms the starting scale of the band offset.
Volatility Expansion Sensitivity
Controls how strongly the band spacing reacts to short-term volatility bursts. Higher values create more pronounced band expansions or contractions.
Trend Persistence Window
Determines how many bars are used to calculate directional trend consistency using a smoothed step function.
Persistence Impact
Scales how much influence the trend persistence has on band widening. Values range from 0 (no effect) to 1 (maximum effect).
Min Effective Mult
Sets the minimum value that the adjusted multiplier can reach. Prevents the bands from becoming too narrow.
Max Effective Mult
Sets the maximum value the adjusted multiplier can reach. Prevents the bands from over-expanding during high volatility.
Bars Above/Below to Confirm Flip
Number of consecutive bars required to close above or below the opposing trail before confirming a bullish or bearish flip. Helps reduce noise and false signals.
Show Flip Labels
Enables or disables the display of flip markers on the chart.
Label Size
Allows users to adjust the size of flip labels from Tiny to Huge.
Label ATR Offset
Adjusts the vertical placement of flip labels in relation to the trail using an ATR-based offset.
Features and Logic
EMA Basis: All calculations stem from an EMA that tracks the centerline of price action.
Dynamic ATR Multiplier: The ATR multiplier adjusts in real time based on volatility expansion and trend persistence.
Clamped Multiplier: The adjusted multiplier is limited between user-defined minimum and maximum values to keep the band scale practical.
Upper and Lower Bands: Bands are plotted above and below the EMA using the dynamic multiplier and ATR values.
Trailing Logic: The script uses Supertrend-style trailing logic, updating the active band in the current trend direction and resetting the opposite band.
Trend State Detection: A state variable tracks the current market regime (bullish, bearish, or neutral). Transitions are confirmed only after a user-specified number of bars close beyond the respective bands.
Visual Elements: Trail lines and fill zones are color-coded (bullish cyan, bearish magenta). Candlestick and bar colors match the trend state. Optional flip labels mark confirmed transitions.
Alerts: Built-in alert conditions allow users to receive real-time notifications for bullish or bearish flips.
Usage Guidelines
This indicator can be used for:
Defining context-aware dynamic stop levels that adjust with market behavior.
Identifying trend direction and reversal points based on adaptive logic.
Filtering entry or exit signals during trending vs. consolidating conditions.
Supplementing trade management strategies with responsive visual markers.
Entering long or short positions based on the appearance of flip labels and managing stop losses by following the adaptive trail.
Traders may tune the parameters to suit different trading styles or timeframes. For example, lower ATR and EMA values may suit intraday setups, while longer settings may benefit swing or positional trading.
Summary
The "Uptrick: Volatility Adjusted Trail" provides a flexible, adaptive trailing band system that accounts for both volatility and directional consistency. By combining an EMA baseline with a dynamic ATR multiplier influenced by volatility expansion and trend persistence, it creates a context-sensitive trailing system that aligns with changing market conditions. Customizable confirmation, flip labels, alerts, and dynamic visual cues make it a versatile tool for trend-following, breakout filtering, and trailing stop logic.
Disclaimer
This indicator is provided for educational and research purposes only. It does not constitute financial advice. Trading involves risk, and past performance does not guarantee future results. Always conduct your own analysis and risk management before making trading decisions.
Options levelsOverview
Options Levels 🎯 plots 13 key institutional and options-based levels directly on your chart — including Call Wall, Put Wall, Gamma Flip, Whales Pivot, five Whale levels, and Sigma deviation bands (σ¹ / σ²).
It’s designed for both intraday and swing traders, offering a clean visual structure with elegant emoji labels, flexible visibility controls, and precise right-edge extensions for each line.
✨ Key Features
Single structured input with 13 ordered levels:
CallWall, PutWall, GammaFlip, Whales Pivot, Whale1..Whale5, Upperσ1, Upperσ2, Lowerσ1, Lowerσ2
Expressive emoji labels (🟢, 🔴, ⚖️, 🌑, 🐋, σ¹/σ²) optimized for dark themes.
Right-edge alignment: each line extends exactly to its label — no infinite lines.
Group visibility toggles:
• Critical Levels → Call Wall, Put Wall, Gamma Flip, Whales Pivot
• Whale Levels → Whale 1–5
• Sigma Bands → Upper/Lower σ¹ and σ²
Dynamic line-length multipliers that emphasize key levels.
Built-in alert conditions:
• Price crossing above the Call Wall
• Price crossing below the Put Wall
⚙️ Inputs & Settings
📋 Level List (string) : comma-separated list of 13 numeric values.
Example:
🎨 Appearance
• Base line length (bars)
• Label visibility toggle
• Line thickness
• Extend line and label to the right
• Distance (bars) between last candle and label
👁️ Visibility Controls
• Toggle Critical, Whale, or Sigma levels independently
🚀 How to Use
Paste your list of 13 ordered levels into the input field.
Adjust base length and thickness according to your timeframe.
Enable “Extend to the right” to position labels neatly beyond the last candle.
Use visibility toggles to focus on specific level groups (e.g., hide Whale Levels for short-term setups).
Optionally enable alerts to track price breakouts above/below Call and Put Walls.
The plotted levels are derived from aggregated options flow data, institutional positioning, and volatility-based deviations (σ). They serve as reference zones rather than predictive signals, helping visualize where liquidity and dealer hedging pressure may cluster.
📖 Level Definitions
Call Wall 🟢 — The strike with the highest call open interest; potential resistance area.
Put Wall 🔴 — The strike with the highest put open interest; potential support area.
Gamma Flip ⚖️ — Level where total gamma exposure changes sign; may reflect a shift in dealer hedging behavior.
Whales Pivot 🌑 — Represents the average institutional positioning from the previous trading day, reflecting where large option flows were most concentrated.
Whale Levels 🐋 — High-premium or large-volume strikes typically linked to institutional activity.
Upper σ¹ / σ² 📈 — One and two standard deviations above spot; potential overextension zones.
Lower σ¹ / σ² 📉 — One and two standard deviations below spot; potential mean-reversion zones.
Levels are manually input by the user. This script is a visual reference, not a predictive model.
⚠️ Notes
Levels are user-provided (not calculated by this script).
The indicator does not issue buy/sell signals or provide performance guarantees.
Designed purely as a visual aid for contextual market reference.
Optimized with barstate.islast for performance (draws only at the latest bar).
Disclaimer:
This indicator is for educational and visual purposes only. It does not generate buy/sell signals or guarantee future results. User-provided levels are meant for contextual reference only.
Developed for traders who rely on market structure and options flow context. Feedback and suggestions are welcome.

50% Fib Trend Cloud + ATR BandsThis indicator plots two structural 50% fibonacci midpoints from recent confirmed 'left/right' swings that form a *cloud* of equilibrium, then adds a rolling 50% fibonacci range midpoint based on a lookback window that's wrapped in ATR bands. Importantly, it solves a specific trading problem:
Structural midpoints (macro context) are powerful but can lag when price escapes prior ranges. Enter rolling 50% fib + ATR ➡️ which restores real-time balance & tolerance (micro context). Together they show where price is balanced structurally, where it’s balanced right now, and how much volatility to tolerate before acting.
➖➖➖
🔑 Why this is different
Most tools either draw a single midpoint (ex., daily 50%) or ATR bands around a moving average. This script fuses dual swing-based 50% midpoints (structure) + a rolling 50% with ATR (flow), so you don’t lose context when price escapes prior ranges. The cloud tells you who’s in control (fast vs. slow structure). The rolling 50% + ATR tells you how far is “too far” now.
➖➖➖
🧠 What it does (at a glance)
🔸Structural Equilibrium × 2 (Fib1/Fib2)
Two independent 50% midpoints formed from swing pivots (configurable Left/Right bars + optional smoothing). Their gap is the Midpoint Cloud = structural “fair value” zone.
🔸Rolling 50% + ATR Bands
A rolling highest/lowest window computes an always-current 50% rolling midpoint plot; ±ATR × length envelopes define a soft value area and over-stretch boundaries.
🔸Actionable Visuals
Optional fill between Fib1/Fib2, labels, and candle-overlay modes to instantly read regime (above both / below both / between).
🔸Smart Defaults
Timeframe-aware presets for L/R pivots & smoothing; full manual overrides available.
➖➖➖
⚙️ Calculations (plain-English)
🔸Pivot midpoints (Fib1 & Fib2):
1) Detect a swing using `Left/Right` bars
2) Take the swing’s high/low → compute 50%
3) (Optional) Smooth the line (SMA) to stabilize on noisy TFs
4) Repeat with a different sensitivity to get two distinct midpoints
🔸Rolling midpoint:
Highest High / Lowest Low over the last *N* bars → (HH + LL) / 2
🔸ATR levels:
`Upper = Rolling50 + ATR × Mult`, `Lower = Rolling50 − ATR × Mult`
(Typical: ATR length 14–21; Multipliers 2.236 for L1, 5.382 for L2)
➖➖➖
🤖 Auto-Configured Presets (with Manual Override)
💡Goal: make the midpoints “just work” on common timeframes while still letting you dial them in.
💡How Auto Presets work
When Auto Presets = ON, the script picks sensible L/R/S (Left bars / Right bars / Smoothing) for Fib Trend 1 and Fib Trend 2 based on chart timeframe.
🔸Fib 1 (fast) emphasizes *micro-structure* for quicker bias shifts.
🔸Fib 2 (slow) emphasizes *macro-structure* for anchor/bias context.
These defaults keep Fib 1 responsive without jitter and Fib 2 stable without lag.
➡️ Turn Auto Presets = OFF to take full control with the manual inputs described below.
➖➖➖
🛠 Manual Fib Midpoint Settings (when Auto = OFF)
💡Each midpoint uses three knobs:
🔸Pivot Left (L): bars to the left that must be lower/higher to qualify a swing
🔸Pivot Right (R): bars to the right that must be lower/higher to confirm the swing
🔸Smoothing (S): SMA period applied to the raw 50% midpoint (stabilizes noise)
5-Minute optimized defaults
🔸Fib Trend 1: `L21 / R5 / S55` → responsive local structure (entries/exits, re-balancing zones)
🔸Fib Trend 2: `L55 / R13 / S89` → broader structure (trend context, anchors/stops)
Timeframe guidance
🔸1m–3m: may feel a touch laggy → consider ~`L13 / R3 / S34`
🔸15m–1h: defaults remain strong → optionally ~`L34 / R8 / S89`
🔸4h+ : increase span for stability → `L89–144 / R13–21 / S144–233`
➡️ Rule of thumb: shorter L/R = faster detection, longer S = smoother line. Tune until Fib 1 captures the “active swing” and Fib 2 captures the “dominant swing” without whipsaw.
➖➖➖
🎛 Inputs (quick reference)
🔸Fib Trend 1/2: Source (High/Low/Close), Left/Right bars, Smoothing length, Show/Hide, Cloud fill toggle
🔸Rolling 50%: Lookback length, Price basis (Wicks/Close/HLC3/OHLC4), Plot scope (Full / Last N / None)
🔸ATR Bands: ATR length, Multipliers (L1/L2), Plot scope, Line width/colors
🔸Overlay & Labels: Candle overlay mode, Label padding/size, 50% centerline toggle, Plot widths
➖➖➖
🖍️ Candle Coloring & Overlay Modes
💡Purpose: make trend instantly visible on the candles and ATR levels.
1) Color Logic (dropdown)
🔸 Fib Midpoints — Colors by position of price vs. Fib 1 & Fib 2
🔸ATR Zones — Colors by which ATR zone price is in relative to the Rolling 50%
➡️ Price Reference: Choose the input used for the decision (Close, HL2, OHLC3, OHLC4).
➡️Tip: Close is crisp; HL2/OHLC variants are smoother.
2) Overlay Style (dropdown)
🔸 None — No visual change to candles
🔸 Bar Color — Uses `barcolor()` to tint built-in candles (this takes into account your Trading View settings, for instance if you have wicks set to white, they will show up as white with this setting)
🔸 PlotCandles — Draws unified custom candles (body, wick, border) with the same color for maximum clarity
💡Practical use
🔸 Pick Fib Midpoints to read structural bias at a glance (above/below/between the cloud).
🔸 Pick ATR Zones to read value vs. stretch around the Rolling 50% (mean-reversion vs. trend extension).
➖➖➖
📘 How to use
A) Trend confirmation
- Strong bullish bias when price holds above both structural mids; strong bearish when below both.
- Use the Rolling 50% + ATR as a dynamic re-entry zone: pullbacks that respect ATR(L1) often continue the prevailing trend.
B) Transition / mean reversion
- Inside the Cloud (between Fib1 & Fib2) treat behavior as neutralization/re-balancing; range tactics tend to outperform momentum plays.
- In ranges, fades near ±ATR around the rolling 50% can mark short-term edges.
C) Breakout context
- When price leaves the Cloud, the Rolling 50% keeps you anchored so price never feels “floating.” A clean hold outside ATR(L1/L2) suggests regime strength; quick re-entries hint at traps.
➖➖➖
🖼 Chart examples
➡️ Each snapshot shows how the Cloud (structure) and the Rolling 50% + ATR (flow) work together.
1) 1-Minute Downtrend – Cloud as Dynamic Ceiling
- The Cloud slopes down; pullbacks repeatedly fail under the Cloud’s underside.
- Rolling 50% (dashed mid) + ATR(L1) act as a reversion band: rallies stall near upper ATR and rotate lower.
2) 15-Minute Persistent Drift – Structure Guides, Flow Times Entries
- Long drift lower with Cloud overhead.
- Consolidations near the rolling mid resolve in the trend direction; ATR bands frame risk on each attempt.
3) 15-Minute Uptrend (BTC) – From Cloud Escape to Value Stair-Step
- After escaping the prior Cloud, rolling 50% + ATR establish a new higher value area.
- Pullbacks into ATR(L1) produce orderly stair-steps; Cloud remains supportive on deeper dips
4) 5-Minute BTC – Pullback to Value then Rotate
- Strong leg up; retrace tags lower ATR band and rotates back toward the rolling mid.
- Labels (Fib1/Fib2) make the structural context explicit for decision-making.
➖➖➖
🧪 Starter presets
- Intraday (5–15m): Fib1 ~ L21/R5 (smooth 5), Fib2 ~ L55/R13 (smooth 9) • Rolling = 55 • ATR = 14 • L1 = 2.5x, L2 = 5.0x
- Scalping: Shorten lookbacks & smoothing; keep ATR multipliers similar, or tighten L1.
- Swing: Lengthen all lookbacks; consider ATR length 21–28.
➖➖➖
🏁Final Word
This script is not just a visual tool, it’s a complete trend and structure framework. Whether you're looking for clean trend alignment, dynamic support/resistance, or early warning signs of a reversal, this system is tuned to help you react with confidence — not hindsight.
Rembember, no single indicator should be used in isolation. For best results, combine it with price action analysis, higher-timeframe context, and complementary tools like trendlines, moving averages etc Use it as part of a well-rounded trading approach to confirm setups — not to define them alone.
---
💡Turn logic into clarity. Structure into trades. And uncertainty into confidence.
