Dynamic Pivot Point [MarkitTick]Title: Dynamic Pivot Point MarkitTick
Concept
Unlike traditional Pivot Points, which plot static horizontal levels based on the previous period's High, Low, and Close, this script introduces a dynamic element by applying an Exponential Moving Average (EMA) to the calculated pivot levels. This approach allows the Support and Resistance zones to adapt more fluidly to recent price action, reducing the jagged steps often seen in standard multi-timeframe pivot indicators.
How It Works
The script operates in two distinct phases of calculation:
1. Data Extraction and Core Math:
The indicator first requests the High, Low, and Close data from a user-defined timeframe (e.g., Daily, Weekly). Using this data, it calculates the standard Pivot Point (P) alongside three levels of Support (S1, S2, S3) and three levels of Resistance (R1, R2, R3) using standard geometric formulas:
Pivot = (High + Low + Close) / 3
R1 = 2 * Pivot - Low
S1 = 2 * Pivot - High
(Subsequent levels follow standard Floor Pivot logic).
2. Dynamic Smoothing:
Instead of plotting these raw values directly, the script processes each calculated level (P, S1-S3, R1-R3) through an Exponential Moving Average (EMA). The length of this EMA is controlled by the Pivot Length input. This smoothing process filters out minor volatility and creates curved, dynamic trajectories for the pivot levels rather than static straight lines.
How to Use
Traders can use this tool to identify dynamic areas of interest where price may react.
The White Line represents the Central Pivot. Price action relative to this line helps determine the immediate bias (above for bullish, below for bearish).
Green Lines (Support 1, 2, 3) indicate potential demand zones where price may bounce during a downtrend.
Red Lines (Resistance 1, 2, 3) indicate potential supply zones where price may reject during an uptrend.
Because the levels are smoothed, they can also act as dynamic trend followers, similar to moving averages, but derived from pivot geometry.
Settings
Show Pivot Points: Toggles the visibility of the plot lines on the chart.
Pivot Length: Defines the lookback period for the EMA smoothing applied to the pivot levels. A higher number results in smoother, slower-reacting lines.
Timeframe: Determines the timeframe used for the underlying High/Low/Close data (e.g., selecting "D" calculates pivots based on Daily data while viewing a lower timeframe chart).
Disclaimer This tool is for educational and technical analysis purposes only. Breakouts can fail (fake-outs), and past geometric patterns do not guarantee future price action. Always manage risk and use this tool in conjunction with other forms of analysis.
Supportresistancelevels

Smart MTF S/R Levels[BullByte]
Smart MTF S/R Levels
Introduction & Motivation
Support and Resistance (S/R) levels are the backbone of technical analysis. However, most traders face two major challenges:
Manual S/R Marking: Drawing S/R levels by hand is time-consuming, subjective, and often inconsistent.
Multi-Timeframe Blind Spots: Key S/R levels from higher or lower timeframes are often missed, leading to surprise reversals or missed opportunities.
Smart MTF S/R Levels was created to solve these problems. It is a fully automated, multi-timeframe, multi-method S/R detection and visualization tool, designed to give traders a complete, objective, and actionable view of the market’s most important price zones.
What Makes This Indicator Unique?
Multi-Timeframe Analysis: Simultaneously analyzes up to three user-selected timeframes, ensuring you never miss a critical S/R level from any timeframe.
Multi-Method Confluence: Integrates several respected S/R detection methods—Swings, Pivots, Fibonacci, Order Blocks, and Volume Profile—into a single, unified system.
Zone Clustering: Automatically merges nearby levels into “zones” to reduce clutter and highlight areas of true market consensus.
Confluence Scoring: Each zone is scored by the number of methods and timeframes in agreement, helping you instantly spot the most significant S/R areas.
Reaction Counting: Tracks how many times price has recently interacted with each zone, providing a real-world measure of its importance.
Customizable Dashboard: A real-time, on-chart table summarizes all key S/R zones, their origins, confluence, and proximity to price.
Smart Alerts: Get notified when price approaches high-confluence zones, so you never miss a critical trading opportunity.
Why Should a Trader Use This?
Objectivity: Removes subjectivity from S/R analysis by using algorithmic detection and clustering.
Efficiency: Saves hours of manual charting and reduces analysis fatigue.
Comprehensiveness: Ensures you are always aware of the most relevant S/R zones, regardless of your trading timeframe.
Actionability: The dashboard and alerts make it easy to act on the most important levels, improving trade timing and risk management.
Adaptability: Works for all asset classes (stocks, forex, crypto, futures) and all trading styles (scalping, swing, position).
The Gap This Indicator Fills
Most S/R indicators focus on a single method or timeframe, leading to incomplete analysis. Manual S/R marking is error-prone and inconsistent. This indicator fills the gap by:
Automating S/R detection across multiple timeframes and methods
Objectively scoring and ranking zones by confluence and reaction
Presenting all this information in a clear, actionable dashboard
How Does It Work? (Technical Logic)
1. Level Detection
For each selected timeframe, the script detects S/R levels using:
SW (Swing High/Low): Recent price pivots where reversals occurred.
Pivot: Classic floor trader pivots (P, S1, R1).
Fib (Fibonacci): Key retracement levels (0.236, 0.382, 0.5, 0.618, 0.786) over the last 50 bars.
Bull OB / Bear OB: Institutional price zones based on bullish/bearish engulfing patterns.
VWAP / POC: Volume Weighted Average Price and Point of Control over the last 50 bars.
2. Level Clustering
Levels within a user-defined % distance are merged into a single “zone.”
Each zone records which methods and timeframes contributed to it.
3. Confluence & Reaction Scoring
Confluence: The number of unique methods/timeframes in agreement for a zone.
Reactions: The number of times price has touched or reversed at the zone in the recent past (user-defined lookback).
4. Filtering & Sorting
Only zones within a user-defined % of the current price are shown (to focus on actionable areas).
Zones can be sorted by confluence, reaction count, or proximity to price.
5. Visualization
Zones: Shaded boxes on the chart (green for support, red for resistance, blue for mixed).
Lines: Mark the exact level of each zone.
Labels: Show level, methods by timeframe (e.g., 15m (3 SW), 30m (1 VWAP)), and (if applicable) Fibonacci ratios.
Dashboard Table: Lists all nearby zones with full details.
6. Alerts
Optional alerts trigger when price approaches a zone with confluence above a user-set threshold.
Inputs & Customization (Explained for All Users)
Show Timeframe 1/2/3: Enable/disable analysis for each timeframe (e.g., 15m, 30m, 1h).
Show Swings/Pivots/Fibonacci/Order Blocks/Volume Profile: Select which S/R methods to include.
Show levels within X% of price: Only display zones near the current price (default: 3%).
How many swing highs/lows to show: Number of recent swings to include (default: 3).
Cluster levels within X%: Merge levels close together into a single zone (default: 0.25%).
Show Top N Zones: Limit the number of zones displayed (default: 8).
Bars to check for reactions: How far back to count price reactions (default: 100).
Sort Zones By: Choose how to rank zones in the dashboard (Confluence, Reactions, Distance).
Alert if Confluence >=: Set the minimum confluence score for alerts (default: 3).
Zone Box Width/Line Length/Label Offset: Control the appearance of zones and labels.
Dashboard Size/Location: Customize the dashboard table.
How to Read the Output
Shaded Boxes: Represent S/R zones. The color indicates type (green = support, red = resistance, blue = mixed).
Lines: Mark the precise level of each zone.
Labels: Show the level, methods by timeframe (e.g., 15m (3 SW), 30m (1 VWAP)), and (if applicable) Fibonacci ratios.
Dashboard Table: Columns include:
Level: Price of the zone
Methods (by TF): Which S/R methods and how many, per timeframe (see abbreviation key below)
Type: Support, Resistance, or Mixed
Confl.: Confluence score (higher = more significant)
React.: Number of recent price reactions
Dist %: Distance from current price (in %)
Abbreviations Used
SW = Swing High/Low (recent price pivots where reversals occurred)
Fib = Fibonacci Level (key retracement levels such as 0.236, 0.382, 0.5, 0.618, 0.786)
VWAP = Volume Weighted Average Price (price level weighted by volume)
POC = Point of Control (price level with the highest traded volume)
Bull OB = Bullish Order Block (institutional support zone from bullish price action)
Bear OB = Bearish Order Block (institutional resistance zone from bearish price action)
Pivot = Pivot Point (classic floor trader pivots: P, S1, R1)
These abbreviations appear in the dashboard and chart labels for clarity.
Example: How to Read the Dashboard and Labels (from the chart above)
Suppose you are trading BTCUSDT on a 15-minute chart. The dashboard at the top right shows several S/R zones, each with a breakdown of which timeframes and methods contributed to their detection:
Resistance zone at 119257.11:
The dashboard shows:
5m (1 SW), 15m (2 SW), 1h (3 SW)
This means the level 119257.11 was identified as a resistance zone by one swing high (SW) on the 5-minute timeframe, two swing highs on the 15-minute timeframe, and three swing highs on the 1-hour timeframe. The confluence score is 6 (total number of method/timeframe hits), and there has been 1 recent price reaction at this level. This suggests 119257.11 is a strong resistance zone, confirmed by multiple swing highs across all selected timeframes.
Mixed zone at 118767.97:
The dashboard shows:
5m (2 SW), 15m (2 SW)
This means the level 118767.97 was identified by two swing points on both the 5-minute and 15-minute timeframes. The confluence score is 4, and there have been 19 recent price reactions at this level, indicating it is a highly reactive zone.
Support zone at 117411.35:
The dashboard shows:
5m (2 SW), 1h (2 SW)
This means the level 117411.35 was identified as a support zone by two swing lows on the 5-minute timeframe and two swing lows on the 1-hour timeframe. The confluence score is 4, and there have been 2 recent price reactions at this level.
Mixed zone at 118291.45:
The dashboard shows:
15m (1 SW, 1 VWAP), 5m (1 VWAP), 1h (1 VWAP)
This means the level 118291.45 was identified by a swing and VWAP on the 15-minute timeframe, and by VWAP on both the 5-minute and 1-hour timeframes. The confluence score is 4, and there have been 12 recent price reactions at this level.
Support zone at 117103.10:
The dashboard shows:
15m (1 SW), 1h (1 SW)
This means the level 117103.10 was identified by a single swing low on both the 15-minute and 1-hour timeframes. The confluence score is 2, and there have been no recent price reactions at this level.
Resistance zone at 117899.33:
The dashboard shows:
5m (1 SW)
This means the level 117899.33 was identified by a single swing high on the 5-minute timeframe. The confluence score is 1, and there have been no recent price reactions at this level.
How to use this:
Zones with higher confluence (more methods and timeframes in agreement) and more recent reactions are generally more significant. For example, the resistance at 119257.11 is much stronger than the resistance at 117899.33, and the mixed zone at 118767.97 has shown the most recent price reactions, making it a key area to watch for potential reversals or breakouts.
Tip:
“SW” stands for Swing High/Low, and “VWAP” stands for Volume Weighted Average Price.
The format 15m (2 SW) means two swing points were detected on the 15-minute timeframe.
Best Practices & Recommendations
Use with Other Tools: This indicator is most powerful when combined with your own price action analysis and risk management.
Adjust Settings: Experiment with timeframes, clustering, and methods to suit your trading style and the asset’s volatility.
Watch for High Confluence: Zones with higher confluence and more reactions are generally more significant.
Limitations
No Future Prediction: The indicator does not predict future price movement; it highlights areas where price is statistically more likely to react.
Not a Standalone System: Should be used as part of a broader trading plan.
Historical Data: Reaction counts are based on historical price action and may not always repeat.
Disclaimer
This indicator is a technical analysis tool and does not constitute financial advice or a recommendation to buy or sell any asset. Trading involves risk, and past performance is not indicative of future results. Always use proper risk management and consult a financial advisor if needed.

Higher Timeframe Support/ResistanceMulti-Timeframe Support/Resistance Indicator
This TradingView indicator helps you monitor important support and resistance levels based on the previous candle’s high, low, and close from a higher timeframe. By default, it uses a daily timeframe, but you can adjust this to any timeframe you want.
Key Features:
- Previous Candle High (PCH) and Previous Candle Low (PCL):
These levels are plotted on your chart (if enabled) and can act as potential support and
resistance zones. You can toggle the visibility of these levels.
- Pivot, Resistance (R1), and Support (S1):
The script calculates Pivot, R1 (Resistance), and S1 (Support) levels based on the previous
candle's price action from the selected higher timeframe.
These levels are displayed on your chart and can be used to identify potential breakout or
reversal points.
- Alert Feature:
Alerts are triggered when the price approaches any of these key levels (PCH, PCL, Pivot, R1,
or S1) within a specified threshold (e.g., 0.5%).
This helps traders react quickly to potential price movements near critical levels.
- Visual Representation:
The script visually fills the areas between Pivot and R1 (Resistance-Pivot Zone) and Pivot and
S1 (Support-Pivot Zone) with color for easy identification of key price zones.

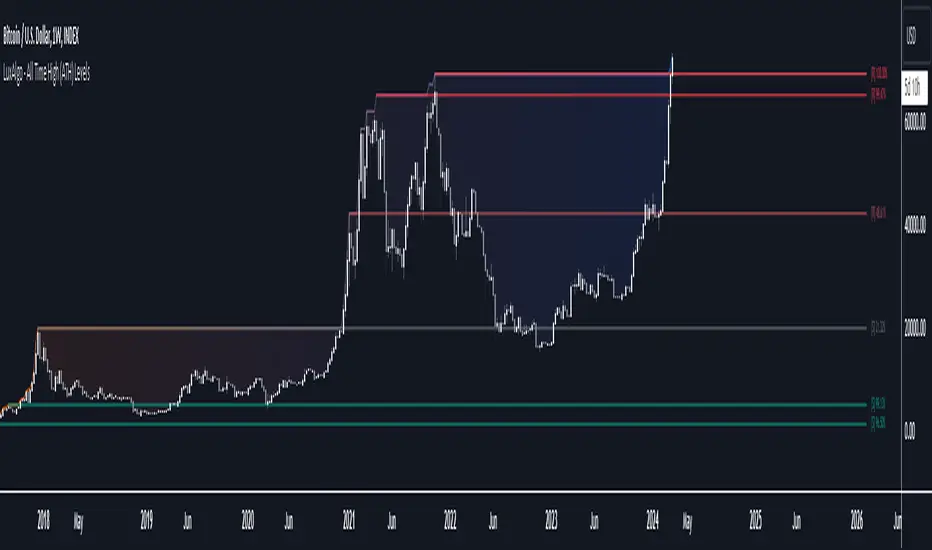
All Time High (ATH) Levels [LuxAlgo]The All Time High (ATH) Levels indicator displays a user-set amount of historical all-time high levels made on the user's chart, highlighting potential key price levels.
Displayed levels can be filtered out based on their duration, as well as their relative distance from each other.
The script also evaluates the role a level might have as a support or resistance using a percentage, classifying ATH levels as either support or resistance depending on the result.
🔶 USAGE
On certain assets market participants give a high level of attention to all-time highs made by an asset, with the most pertinent example being Bitcoin.
Previous all-time highs can play important roles as psychological price levels, with the most recent ones often offering major resistance points, and older ones being used as support.
Users can filter out temporary ATHs using the ATH Minimum Duration setting, removing any ATH that lasts less than the user-specified number of bars. Higher values of this setting effectively preserve ATHs that become distinguishable peaks. These can offer more significant support/resistance levels.
When displaying each historical level some of them can be very close to each other. Users can use the "Minimum Distance Between ATH" setting to filter out levels too close to each other, with higher values of this setting returning more spaced levels. Distances are first evaluated from the most recent ATH. Note that this setting can cause repainting.
🔹 SR Classification
The script evaluates the ability of an ATH level to act as a support or resistance since its occurrence, and measures its strength as a percentage, with higher percentage values suggesting a stronger support or resistance.
Levels classified with "R" suggest that the price was located below the level most of the time, indicative of a resistance, while a level classified with "S" suggests that the price was located above the level most of the time, indicative of a support.
Percentages between 99% to 50% are often indicative of supports/resistances being tested, while values below 50% reflect more centered levels. A value of 100% suggests that an ATH level was not tested enough. users can filter out any level with a percentage below the "Minimum %" setting.
🔶 SETTINGS
Show Last ATH: Specify the amount of most recent ATH's to display.
ATH Minimum Duration: Minimum duration (in bars) of an ATH, that is the minimum number of bars that must elapse before another ATH can be made.
Minimum Distance Between ATH: Minimum distance between displayed ATH levels, starting from the most recent ATH. This distance is a multiple of the average true range.
🔹 SR Classification
Show SR%: Show percentage as well as ATH level classification.
Minimum %: Minimum percentage values required to display an ATH level.
HT: Intraday LevelsIndicator draws several most important intraday levels: last day RTH high/low, ETH high/low, Half Back, Day Close and current day RTH Day Open. These levels often act as support/resistance for intraday price movements. Also, they can help to assess day character and control of power.
Indicator can be used for ETH + RTH sessions.
Important notes:
• User must specify RTH session time, appropriate for his time zone and exchange
• Half-back is calculated as a middle line between RTH High and Low.
• Day Close is always equal to close of the last bar of the previous day
• RTH Day Open will be redrawn for the current day as soon as it is known (after RTH session opens and at least one bar gets confirmed).
Known issues:
• Day open will not be shown if there is no bar, clearly corresponding to RTH open time (e.g. if 4h timeframe is selected)
• For some ETH sessions it is not possible to determine session’s last bar (this is pine script limitation) until next day trading starts. This means that daily levels will be also update with only then.
Parameters:
Date – user can select date, for which levels will be plotted. Works only if “Use” check box is on. Otherwise, levels will be plotted for the last day. (“time” value doesn’t matter; unfortunately, there is no way to hide the input box)
RTH Open/Close time – it is important to specify time, appropriate for your time zone.
Time zone – your chart time zone (as UTC offset)
Visuals – controls visibility and colors
Script is published as an open source. It uses two libraries: Levels Lib and Functions Lib. First one demonstrates how to work with pine-script object model and arrays. You can also reuse it in your custom scripts where there is need to construct any support/resistance levels. The second library contains some useful functions for working with time and dates.
Disclaimer
This indicator should not be used as a standalone tool to make trading decisions but only in conjunction with other technical analysis methods.
