Break-Retest-Scale [v1]Break-Retest-Scale is a Break of Structure (BOS) retest strategy that uses a Thirds exit pattern to scale out of winning trades while protecting profits.
How It Works
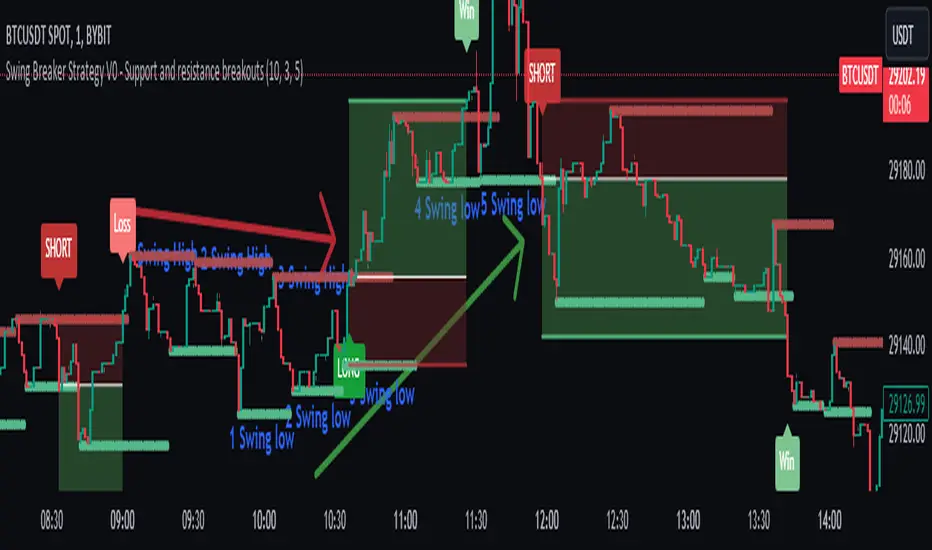
BOS Detection : Price breaks above a swing high (bullish) or below a swing low (bearish)
Retest Window : Strategy waits for price to return and test the broken level
Entry : When price touches the retest zone and closes back on the right side
Exit : Position is split into thirds with escalating profit targets
Exit Structure (Thirds Pattern)
Exit Size Target Stop After
TP1 33% 1R Initial SL
TP2 33% 2R Breakeven
TP3 34% 3R Breakeven
After TP1 is hit, the stop automatically moves to breakeven (with a small ATR buffer to avoid stop-hunting wicks).
Key Features
Split Pivot Detection : Separate left/right bars for swing significance vs detection speed
Reclaim Modes : Three entry styles - Close, Wick Rejection, Full Bar (strictest)
Volume Filter : Optional above-average volume requirement on BOS
Frozen Brackets : SL and TP levels are locked at entry - they don't drift with changing ATR
Smart BE Detection : Uses position reduction to detect TP1 hit (more reliable than price checks)
Structure-Based SL : Stop is placed below/above the last swing with an ATR floor for minimum distance
BOS Max Age : Swing levels expire after N bars to prevent stale breakouts
Validated Results
Instrument Period Net P&L PF Win % Max DD
MYM 5min Aug-Feb 2026 +56.6% 2.10 52% 11.9%
MES 5min Dec-Feb 2026 +51.9% 6.57 57.5% 7.3%
M2K 5min Dec-Feb 2026 +42.6% 4.01 51.4% 7.2%
Recommended Settings
MES 5min (Best Performance)
Structure: Left=20, Right=2, Tol=0.2, Window=9, Age=20
Reclaim Mode: Full Bar, Volume Filter: ON
Risk: SL ATR Min=1.25, SL Buffer=0.2
TP1/TP2/TP3: 0.7R / 1.5R / 4R
M2K 5min (Balanced)
Structure: Left=16, Right=3, Tol=0.1, Window=11, Age=30
Reclaim Mode: Close, Volume Filter: ON
Risk: SL ATR Min=1.5, SL Buffer=0.1
TP1/TP2/TP3: 1R / 3R / 3.5R
MYM 5min (Long-Bias)
Structure: Left=16, Right=4, Tol=0.4, Window=15, Age=35
Reclaim Mode: Close, Volume Filter: ON
Risk: SL ATR Min=1.0, SL Buffer=0.2
TP1/TP2/TP3: 1R / 1.5R / 2R
Multi-Instrument Position Sizing
With strategy.fixed , position size meaning varies by instrument type:
Instrument Position Size = Example
Futures Contracts 3 = 3 contracts
FX Units of base currency 30000 = 0.3 lots
Crypto Coins/tokens 0.1 = 0.1 BTC
Stocks Shares 100 = 100 shares
Important Notes
Position size must be divisible by 3 for Thirds exit to work correctly
For FX: use units (30000), not lots (0.3)
Sunday filter is enabled by default to avoid FX gaps
The "look-ahead bias" warning is a false positive - the strategy uses lookahead=barmerge.lookahead_off
Commission and slippage are set for futures - adjust in Properties for your instrument
Margin is set to 5% ($500 per contract on $10K account) - adjust in code or Properties if needed
Strategy logic is not meant to be financial advice. Always backtest on your specific instrument and timeframe.
Pine Script®策略