A Humbled Trader Strategy + ChecklistHumbled Trader Swing Strategy + Checklist
This indicator is a complete swing trading system based on the high-probability strategies popularized by Humbled Trader. It is designed to help traders identify trend breakouts and low-risk momentum pullbacks on the Daily Timeframe.
The script combines trend filtering, automated resistance lines, and specific entry triggers into a single chart overlay, complete with a real-time Strategy Checklist Dashboard to confirm your setups instantly.
🎯 Core Components
Trend Filter (Purple Line): The 200 Simple Moving Average (SMA). This acts as your long-term trend filter. We only look for long trades when the price is above this line.
Momentum Guide (Orange Line): The 8 Exponential Moving Average (EMA). This tracks short-term momentum. In a strong trend, price will "ride" this line. We look to enter when price pulls back to touch this area.
Multi-Month Resistance (Orange Horizontal Line): Automatically plots the highest price over the last X Months (adjustable). This helps you instantly visualize the key level the stock needs to break out from.
Checklist Dashboard: A real-time table that evaluates Trend, Resistance, and Momentum conditions to give you a clear "✅ ENTER", "🚀 GAP UP", or "⏳ WAIT" signal.
🛠 How It Works
This indicator scans for two specific setups:
1. The Daily Gap Up ("GAP" Label) This signal appears when a stock shows strong momentum by gapping up overnight.
Condition: The stock opens at least 3% higher (adjustable) than the previous day's Close AND opens above the previous day's High.
Trend: Must be above the 200 SMA.
Visual: Marked with a green "GAP" label on the chart.
2. The Trend Pullback ("ENTER" Signal) This is a trend-following entry that lets you join an existing move with lower risk.
Condition: The stock is in an uptrend but dips down to touch or test the 8 EMA.
Validation: The candle must show a "dip" (red candle or lower close) to ensure we are buying a pullback, not chasing a top.
Visual: The Dashboard "Action Signal" will turn orange and display "✅ ENTER".
📋 The Checklist Dashboard
Located in the corner of your chart, this table provides a live status report for the current bar:
Trend (> 200 SMA):
🟢 Bullish: Price is in an uptrend. Safe to look for entries.
🔴 Bearish: Price is below the 200 SMA. Stay away.
Above Resistance?:
🟢 Breakout: Price has cleared the multi-month resistance line.
⚪ ---: Price is currently below the key breakout level.
Near 8 EMA?:
🟢 Yes: Price is near the "value zone" (8 EMA) for a potential pullback entry.
Action Signal:
🚀 GAP UP: Strong momentum gap detected.
✅ ENTER: Valid pullback entry detected.
⏳ WAIT: No clear setup found.
⚙️ Settings
Momentum EMA Length: Default is 8. Controls the sensitivity of the pullback line.
Trend SMA Length: Default is 200. The standard for long-term trend filtering.
Gap Up % Threshold: Default is 3.0%. Minimum overnight gap size required to trigger a signal.
Resistance Lookback (Months): Default is 3. The script will look back this many months to find and draw the key resistance line.
Table Position: Move the checklist to any corner of your screen.
⚠️ Disclaimer
This tool is for educational purposes only and does not constitute financial advice. Always manage your risk and use a stop loss.
Swingtrader

Smart Trader,Episode 1, by Ata Sabanci | Unified Matrix⚠️ **CRITICAL: READ BEFORE USING** ⚠️
This strategy is **100% VOLUME-BASED** and requires **Lower Timeframe (LTF) intrabar data** for accurate calculations. Please understand the following limitations before using:
**📊 DATA ACCURACY LEVELS:**
• **1T (Tick)** — Most accurate, real volume distribution per tick
• **1S (1 Second)** — Reasonably accurate approximation
• **15S (15 Seconds)** — Good approximation, longer historical data available
• **1M (1 Minute)** — Rough approximation, maximum historical data range
**⚠️ BACKTEST & REPLAY LIMITATIONS:**
• TradingView's Strategy Tester uses historical LTF data which may be limited depending on your subscription plan
• Replay mode results may differ from live trading due to data availability
• For longer backtest periods, use higher LTF settings (15S or 1M)
• Not all symbols/exchanges support tick-level data
• Crypto and Forex typically have better LTF data availability than stocks
**💡 A NOTE ON TOOLS:**
Successful trading requires proper tools. Higher TradingView plans provide access to more historical intrabar data, which directly impacts the accuracy of volume-based calculations. More precise volume data leads to more reliable signals. Consider this when evaluating your trading infrastructure.
**WHY "EPISODE 1"?**
This strategy is titled "Episode 1" because it focuses exclusively on **Highest Buyers (HB)** — a single but powerful concept in volume analysis.
**The Philosophy:**
A single high-volume buying event can tell us a story about market psychology:
• Where did the biggest buyers enter?
• How much of their power remains?
• Are sellers consuming their advantage?
• At what rate is the balance shifting?
By focusing on just ONE aspect of volume analysis, traders can deeply understand how a buying surge affects future price action before moving to more complex multi-factor analysis.
**The Reality:**
This script alone is approximately **2000 lines of code** — and it only analyzes buyers. A comprehensive system covering all aspects (sellers, combined analysis, multi-timeframe correlation) would be significantly larger and computationally heavier. Breaking this into focused modules allows for:
• Deeper understanding of each component
• Lighter, more responsive scripts
• Educational progression from simple to complex
**OVERVIEW**
Smart Trader EP1 is a volume-based trading strategy that tracks the balance of power between buyers and sellers through the lens of the **Highest Buyers event**. Unlike traditional indicators that rely on price patterns or mathematical formulas, this strategy analyzes *actual volume flow* to identify who is in control of the market.
The core philosophy is simple: **markets move when one side (buyers or sellers) exhausts their power while the opposing side accumulates strength.** By measuring this power shift in real-time, the strategy identifies high-probability entry and exit points.
**HOW IT WORKS**
**1. Volume Engine**
The strategy splits each candle's volume into buying volume and selling volume using intrabar data. In *Intrabar (Precise)* mode, it uses actual tick-by-tick or second-by-second data to calculate the exact buy/sell distribution. In *Geometry* mode, it approximates based on candle structure (close position within the range).
**2. Event Detection**
Within the lookback window, the strategy identifies key events:
• **HB (Highest Buyers)** — The candle with maximum buying volume (potential resistance when exhausted)
• **HS (Highest Sellers)** — The candle with maximum selling volume (potential support when exhausted)
• **LB (Lowest Buyers)** — The candle with minimum buying volume (buyer absence)
• **LS (Lowest Sellers)** — The candle with minimum selling volume (seller absence)
These events create dynamic support and resistance levels based on actual volume, not arbitrary price levels.
**3. Power Tracking (Attrition Model)**
For the Highest Buyers event (HB), the strategy tracks:
• **Start Power (X)** — The initial buying volume at the HB event
• **Consumed Power (Y)** — How much selling volume has accumulated since the event
• **Remaining Power (Z)** — Start Power minus Consumed Power (X - Y)
• **Opponent Dominance** — When Remaining Power goes negative (Z < 0), sellers have overtaken buyers
Think of it like a battle: buyers establish a position (HB), and sellers gradually consume their power. When buyers' power is exhausted (Remaining Power ≤ 0), sellers have taken control.
**4. Depletion Markers**
Visual markers appear on the chart when power reaches critical thresholds:
• **🔋** — Buyers consumed 100% (Remaining = 0)
• **🚨** — Buyers consumed 200% (Opponent Dominance = 100%)
• **🪫** — Sellers consumed 100%
• **⚠️** — Sellers consumed 200%
**5. Cumulative Delta**
Beyond tracking power at specific events, the strategy calculates the cumulative buy volume minus sell volume since the HB event. This shows the *net flow* of money:
• **Positive Delta** — More buying than selling since HB (bullish pressure)
• **Negative Delta** — More selling than buying since HB (bearish pressure)
**6. Trend Channel**
A 5-point linear regression channel identifies the current trend:
• **UPTREND** — Both upper and lower channel lines slope upward
• **DOWNTREND** — Both lines slope downward
• **RANGING** — Mixed or flat slopes
The strategy also tracks where the HB event occurred within this channel (TOP, UPPER, MIDDLE, LOWER, BOTTOM) to contextualize the signal.
**7. Nearest Event Analysis**
The strategy identifies which event is closest to the current candle and analyzes the price action *after* that event:
• How many bullish vs bearish candles followed?
• Does post-event momentum confirm or contradict the event type?
This prevents false signals when, for example, a bearish event occurs but is immediately followed by strong bullish candles.
**SIGNAL LOGIC**
**🟢 LONG Signal Conditions:**
• Uptrend with positive cumulative delta and buyers accumulating
• At channel bottom/lower with strong buyer power remaining
• After a bearish event (HS) with bullish post-event momentum (reversal signal)
• Ranging market with positive delta and strong power
**🔴 SHORT Signal Conditions:**
• Downtrend with negative cumulative delta and sellers in control
• Opponent Dominance (buyer power exhausted) with bearish momentum
• Buyer Trap: HB at TOP in uptrend but power exhausted and delta negative
• After a bullish event (HB) with bearish post-event momentum (trap signal)
**⏳ NO_TRADE Conditions:**
• Conflicting signals (e.g., bearish event but bullish post-momentum)
• Ranging market without clear direction
• Mixed power readings
• Price position contradicts signal direction
**STRATEGY EXECUTION**
**Entry Rules:**
• Enter LONG when signal is "LONG" and conditions are valid
• Enter SHORT when signal is "SHORT" and conditions are valid
• **Pyramid**: Up to 2 entries allowed in the same direction (configurable)
• Each entry uses 10% of equity by default
• Only one entry per confirmed candle (prevents multiple fills)
**Stop Loss (Event Line Based):**
• **LONG positions**: Stop Loss placed below the HS line (seller support level)
• **SHORT positions**: Stop Loss placed above the HB line (buyer resistance level)
• A small buffer percentage is added to prevent premature stops
**Take Profit (Event Line Based):**
• **LONG positions**: Take Profit near the HB line (buyer resistance target)
• **SHORT positions**: Take Profit near the HS line (seller support target)
• A small buffer percentage ensures realistic fill expectations
**Exit Rules:**
• Exit LONG when signal changes to SHORT
• Exit SHORT when signal changes to LONG
• **NO_TRADE signal = HOLD** (do not exit, wait for clear direction)
• SL/TP orders remain active regardless of signal changes
**SETTINGS GUIDE**
**⚙️ General Settings:**
• *Calculation Method* — Choose between Intrabar (Precise) or Geometry (approximation)
• *Intrabar Resolution* — LTF for volume data (1T, 1S, 15S, 1M)
• *Lookback Length* — Window for scanning events (10-150 bars)
• *Timezone Offset* — Adjust clock display to your local time
**📊 Matrix Display Settings:**
• *Show Unified Matrix* — Toggle the information dashboard
• *Show Event Lines* — Toggle horizontal lines at event prices
• *Panel Size/Position* — Customize dashboard appearance
• *Projection Bars* — Extend event lines into the future
• *Depletion Threshold* — Percentage for depletion markers (default: 100%)
**🏷️ Rank Labels Settings:**
• *Show Rank Labels (HB/HS)* — Display labels on highest volume candles
• *Show Low Labels (LB/LS)* — Display labels on lowest volume candles
• *Ranks Count* — Number of rankings to display (1-5)
**📐 Trend Channel Settings:**
• *Show Trend Channel* — Toggle the 5-point regression channel
• *Line Color/Fill/Width/Style* — Customize channel appearance
**🎯 Trade Signal Settings:**
• *Long: Min Remaining Power %* — Minimum buyer power for LONG signal (default: 50%)
• *Short: Max Remaining Power %* — Maximum power for SHORT signal (default: 30%)
• *Opponent Dominance Threshold* — When to consider power "exhausted" (default: 0%)
• *Max Decay Angle* — Maximum consumption rate for valid entries (default: 60°)
**📈 Strategy Execution Settings:**
• *Enable Strategy* — Turn automatic trading on/off
• *Allow LONG/SHORT* — Enable or disable specific directions
• *Max Pyramid Entries* — Maximum entries in same direction (1-3)
• *SL Buffer %* — Distance below/above event line for stop loss (default: 0.15%)
• *TP Buffer %* — Distance from event line for take profit (default: 0.05%)
**VISUAL ELEMENTS**
**Chart Labels:**
• **#1 HB** — Highest Buyers (rank label on candle high)
• **#1 HS** — Highest Sellers (rank label on candle low)
• **#1 LB** — Lowest Buyers (rank label on candle high)
• **#1 LS** — Lowest Sellers (rank label on candle low)
• **🔋 / 🚨** — Buyer power depletion markers
• **🪫 / ⚠️** — Seller power depletion markers
**Event Lines:**
• **Blue horizontal lines** — HB price levels (buyer entry points)
• **Red horizontal lines** — HS price levels (seller entry points)
• **Cyan lines** — LB price levels
• **Orange lines** — LS price levels
• **Dashed extensions** — Projected levels into future bars
**Trend Channel:**
• **Orange lines** — Upper and lower channel boundaries (5-point regression)
• **Orange fill** — Channel area (90% transparency)
**Matrix Dashboard (6 rows):**
• Row 1: Header with symbol, LTF setting, and local clock
• Row 2: Volume snapshot (Total, Buy, Sell, Delta)
• Row 3: Column headers
• Row 4: Highest Buyers data (Age, Start Power, Consumed, Remaining, Decay, ETA)
• Row 5: Highest Sellers data
• Row 6: Signal Evaluation (Trend, Zone, Nearest Event, Signal, Reason)
**Strategy Markers:**
• **Green triangle up** — LONG entry
• **Red triangle down** — SHORT entry
• **Faded triangles** — Pyramid entries
• **Colored lines** — SL (red) and TP (green) levels when in position
**BEST PRACTICES**
**For Maximum Accuracy:**
1. Use **1T (tick)** or **1S** intrabar resolution when available
2. Trade liquid markets with good volume data (crypto majors, forex majors, high-volume stocks)
3. Use smaller lookback length (20-30) to ensure all bars have valid LTF data
4. Monitor the "Intrabar Valid Bars" counter in the matrix header
5. If you see data warnings, reduce lookback or increase LTF resolution
**For Longer Backtests:**
1. Use **15S or 1M** intrabar resolution for more historical data
2. Increase lookback length if needed
3. Understand that accuracy decreases with higher LTF settings
4. Consider using Geometry mode for very long backtests (approximation but always available)
**Understanding the Signals:**
• Pay attention to the signal *reasoning* shown in the matrix — it explains WHY
• **NO_TRADE** means the system sees conflicting factors — respect this caution
• Event lines act as dynamic S/R — they update as new volume events occur
• Cumulative Delta (Δ) often provides early warning of trend changes
**Risk Management:**
• The default 10% per entry with max 2 pyramids = 20% maximum exposure
• Event-line-based SL/TP provides logical levels based on actual volume events
• Always verify signals with your own analysis before trading
**INTERPRETING THE MATRIX**
**Power Status Examples:**
• *Remaining Power: 75%* — Buyers still have most of their strength
• *Remaining Power: 25%* — Buyers nearly exhausted, watch for reversal
• *Opponent Dominance: -50%* — Sellers have consumed 150% of buyer power (strong bearish)
**Decay Angle:**
• *Low angle (0-30°)* — Slow consumption, power lasting longer
• *High angle (60-90°)* — Rapid consumption, expect quick exhaustion
**ETA to Parity:**
• Shows estimated bars until Remaining Power reaches zero
• *"Overtaken"* with 🚨 means sellers have already dominated
**LIMITATIONS & DISCLAIMER**
**Technical Limitations:**
• Requires sufficient historical LTF data (varies by TradingView plan and symbol)
• Intrabar (Precise) mode may show invalid data warnings on symbols with limited history
• Strategy tester may not have access to the same LTF data as live trading
• Maximum 500 lines and 500 labels (TradingView platform limits)
**Important Notes:**
• This strategy focuses on **Highest Buyers only** — it does not analyze all market factors
• Past performance does not guarantee future results
• Volume data quality varies significantly between symbols and exchanges
• The strategy's signals are analytical tools, not trading recommendations
**Risk Disclaimer:**
This strategy is provided for **educational and informational purposes only**. Trading involves substantial risk of loss and is not suitable for all investors.
• Always use proper risk management
• Never risk more than you can afford to lose
• Backtest results may differ significantly from live trading
• You are solely responsible for your trading decisions
**TECHNICAL SPECIFICATIONS**
• Pine Script Version: 6
• Calculation: calc_on_every_tick=true, use_bar_magnifier=true
• Default Capital: 10,000
• Default Position Size: 10% of equity
• Maximum Lines: 500
• Maximum Labels: 500
• External Library: TradingView/ta/10 (for requestUpAndDownVolume)
*Smart Trader EP1 — Understanding Volume, One Event at a Time*

ATR Distance from 50 SMA By DanBobDanA simple indicator that measures the distance between current price and the 50 SMA
The average momentum swing trade might run 7 times the ATR before pulling back
Therefore, its recommended to not buy a stock that is beyond 4 times its ATR to the 50 SMA
This script will quickly and easily calculate the 50 SMA to ATR distance for you

AI Trading Alerts v6 — SL/TP + Confidence + Panel (Fixed)Overview
This Pine Script is designed to identify high-probability trading opportunities in Forex, commodities, and crypto markets. It combines EMA trend filters, RSI, and Stochastic RSI, with automatic stop-loss (SL) & take-profit (TP) suggestions, and provides a confidence panel to quickly assess the trade setup strength.
It also includes TradingView alert conditions so you can set up notifications for Long/Short setups and EMA crosses.
⚙️ Features
EMA Trend Filter
Uses EMA 50, 100, 200 for trend confirmation.
Bull trend = EMA50 > EMA100 > EMA200
Bear trend = EMA50 < EMA100 < EMA200
RSI Filter
Bullish trades require RSI > 50
Bearish trades require RSI < 50
Stochastic RSI Filter
Prevents entries during overbought/oversold extremes.
Bullish entry only if %K and %D < 80
Bearish entry only if %K and %D > 20
EMA Proximity Check
Price must be near EMA50 (within ATR × adjustable multiplier).
Signals
Continuation Signals:
Long if all bullish conditions align.
Short if all bearish conditions align.
Cross Events:
Long Cross when price crosses above EMA50 in bull trend.
Short Cross when price crosses below EMA50 in bear trend.
Automatic SL/TP Suggestions
SL size adjusts depending on asset:
Gold/Silver (XAU/XAG): 5 pts
Bitcoin/Ethereum: 100 pts
FX pairs (default): 20 pts
TP = SL × Risk:Reward ratio (default 1:2).
Confidence Score (0–4)
Based on conditions met (trend, RSI, Stoch, EMA proximity).
Labels:
Strongest (4/4)
Strong (3/4)
Medium (2/4)
Low (1/4)
Visual Panel on Chart
Shows ✅/❌ for each condition (trend, RSI, Stoch, EMA proximity, signal now).
Confidence row with color-coded strength.
Alerts
Long Setup
Short Setup
Long Cross
Short Cross
🖥️ How to Use
1. Add the Script
Open TradingView → Pine Editor.
Paste the full script.
Click Add to chart.
Save as "AI Trading Alerts v6 — SL/TP + Confidence + Panel".
2. Configure Inputs
EMA Lengths: Default 50/100/200 (works well for swing trading).
RSI Length: 14 (standard).
Stochastic Length/K/D: Default 14/3/3.
Risk:Reward Ratio: Default 2.0 (can change to 1.5, 3.0, etc.).
EMA Proximity Threshold: Default 0.20 × ATR (adjust to be stricter/looser).
3. Read the Panel
Top-right of chart, you’ll see ✅ or ❌ for:
Trend → Are EMAs aligned?
RSI → Above 50 (bull) or below 50 (bear)?
Stoch OK → Not extreme?
Near EMA50 → Close enough to EMA50?
Above/Below OK → Price position vs. EMA50 matches trend?
Signal Now → Entry triggered?
Confidence row:
🟢 Green = Strongest
🟩 Light green = Strong
🟧 Orange = Medium
🟨 Yellow = Low
⬜ Gray = None
4. Alerts Setup
Go to TradingView Alerts (⏰ icon).
Choose the script under “Condition”.
Select alert type:
Long Setup
Short Setup
Long Cross
Short Cross
Set notification method (popup, sound, email, mobile).
Click Create.
Now TradingView will notify you automatically when signals appear.
5. Example Workflow
Wait for Confidence = Strong/Strongest.
Check if market session supports volatility (e.g., XAU in London/NY).
Review SL/TP suggestions:
Long → Entry: current price, SL: close - risk_pts, TP: close + risk_pts × RR.
Short → Entry: current price, SL: close + risk_pts, TP: close - risk_pts × RR.
Adjust based on your own price action analysis.
📊 Best Practices
Use on H1 + D1 combo → align higher timeframe bias with intraday entries.
Risk only 1–2% of account per trade (position sizing required).
Filter with market sessions (Asia, Europe, US).
Strongest signals work best with trending pairs (e.g., XAUUSD, USDJPY, BTCUSD).

Smallest Swing [Truth Indie]This indicator is designed to test the smallest swing draw using the swing capture concept of the Pivot Points High Low indicator, setting the length to 1 for all periods, and combining it with price action that I think makes sense.
Example of a valid swing high.
Example of a valid swing low.

StockBee 4% BreakoutThe Stockbee 4% Breakout script is a study tool for users who wants to do a deep dive on StockBee's 4% Breakout momentum burst method. This script will assist a specific group of traders who trade this method easily find historical momentum bursts. This script finds and colors red any candle body that meets the following criteria:
1. Volume of the candle is greater than the previous candle volume.
2. The percent change of candle's price is greater than 4% from the previous candle close.
3. Current candle close is less than 30% from candle's high.
This script also filters out any candle that gaps up and breaks down with a close above 4% the previous candle (Eliminates gap-ups that fade). This tool is meant to find and filter possible candidates. Not every marked candle is a great momentum burst trade.
This is very helpful for Trading View users trading this specific setup.

[blackcat] L2 Swing Oscillator Swing MeterLevel: 2
Background
Swing trading is a type of trading aimed at making short to medium term profits from a trading pair over a period of a few days to several weeks. Swing traders mainly use technical analysis to look for trading opportunities. In addition to analyzing price trends and patterns, these traders can also use fundamental analysis.
Function
L2 Swing Oscillator Swing Meter is an oscillator based on breakouts. Another important feature of it is the swing meter, which confirms the top or bottom's confidence level with different color candles. The higher of the candles stack up, the higher confidence level is indicated.
Key Signal
absolutebot ---> absolute bottom with very high confidence level
ltbot ---> long term bottom with high confidence level
mtbot ---> middle term bottom with moderate confidence level
stbot ---> short term bottom with low confidence level
absolutetop ---> absolute top with very high confidence level
lttop ---> long term top with high confidence level
mttop ---> middle term top with moderate confidence level
sttop ---> short term top with low confidence level
fastline ---> oscillator fast line
slowline ---> oscillator slow line
Pros and Cons
Pros:
1. reconfigurable swing oscillator based on breakouts
2. swing meter can confirm/validate the bottom and top signal
Cons:
1. not appliable with trading pairs without volume information
2. small time frame may not trigger swing meter function
Remarks
This is a simple but very comprehensive technical indicator
Readme
In real life, I am a prolific inventor. I have successfully applied for more than 60 international and regional patents in the past 12 years. But in the past two years or so, I have tried to transfer my creativity to the development of trading strategies. Tradingview is the ideal platform for me. I am selecting and contributing some of the hundreds of scripts to publish in Tradingview community. Welcome everyone to interact with me to discuss these interesting pine scripts.
The scripts posted are categorized into 5 levels according to my efforts or manhours put into these works.
Level 1 : interesting script snippets or distinctive improvement from classic indicators or strategy. Level 1 scripts can usually appear in more complex indicators as a function module or element.
Level 2 : composite indicator/strategy. By selecting or combining several independent or dependent functions or sub indicators in proper way, the composite script exhibits a resonance phenomenon which can filter out noise or fake trading signal to enhance trading confidence level.
Level 3 : comprehensive indicator/strategy. They are simple trading systems based on my strategies. They are commonly containing several or all of entry signal, close signal, stop loss, take profit, re-entry, risk management, and position sizing techniques. Even some interesting fundamental and mass psychological aspects are incorporated.
Level 4 : script snippets or functions that do not disclose source code. Interesting element that can reveal market laws and work as raw material for indicators and strategies. If you find Level 1~2 scripts are helpful, Level 4 is a private version that took me far more efforts to develop.
Level 5 : indicator/strategy that do not disclose source code. private version of Level 3 script with my accumulated script processing skills or a large number of custom functions. I had a private function library built in past two years. Level 5 scripts use many of them to achieve private trading strategy.

[blackcat] L1 Whale Jumping out of the OceanLevel: 1
Background
One of the biggest differences between cryptocurrency and traditional financial markets is that cryptocurrency is based on blockchain technology. Individual investors can discover the direction of the flow of large funds through on-chain transfers. These large funds are often referred to as Whale. Whale can have a significant impact on the price movements of cryptocurrencies, especially Bitcoin . Therefore, how to monitor Whale trends is of great significance both in terms of fundamentals and technical aspects.
We often see whales suddenly jump out of the ocean and then set off huge waves. What we need to do is to surf the wave according to the trend after the whale jumps out of the sea. This is really an exciting sport!
Function
By modeling the behavior of Whale and individuals (Surfers), L1 Whale Jumping out of the Ocean can not only simply describe the behavior trends of Whale and individuals, but also describe the shape of waves generated by the whale jump. Individual traders need to follow the wave trend to take profit.
NOTE: white line and yellow candles represent whale appears but it CANNOT indicate the direction as PUMP or DUMP. This indicator is one of the whale series. It is featured by vividness. A technical indicator is drawn as ocean (momentum in blue and aqua), whale (whale PUMP/DUMP in white,yellow, red, fuchsia and green), huge wave (mid-term trend or swing trend in aqua and blue).However, it does not accurately generate buying and selling points.
Key Signal
var01 --> huge wave caused by whale jump. it is used to confirm whale jump and describe the trend of wave for surfers.
var02 --> whale move signal
var12 --> whale move signal
var28 --> high confidence level of huge whale move
dynabot --> deep ocean (dynamic bottom)
Pros and Cons
Pros:
1. Detect Whale pump and dump and the strength of huge wave.
2. Vividly compare the market movement to a huge wave caused by a whale jumping out of the sea.
3. When it resonante with buy or sell signal from other independent indicators, it has higher confidence level.
Cons:
1. No exact long and short entries.
2. It is sensitive and may have noise inside and generate fake entry signal.
Remarks
Please do not think that this is just a technical indicator, this is a documentary about whales.
Readme
In real life, I am a prolific inventor. I have successfully applied for more than 60 international and regional patents in the past 12 years. But in the past two years or so, I have tried to transfer my creativity to the development of trading strategies. Tradingview is the ideal platform for me. I am selecting and contributing some of the hundreds of scripts to publish in Tradingview community. Welcome everyone to interact with me to discuss these interesting pine scripts.
The scripts posted are categorized into 5 levels according to my efforts or manhours put into these works.
Level 1 : interesting script snippets or distinctive improvement from classic indicators or strategy. Level 1 scripts can usually appear in more complex indicators as a function module or element.
Level 2 : composite indicator/strategy. By selecting or combining several independent or dependent functions or sub indicators in proper way, the composite script exhibits a resonance phenomenon which can filter out noise or fake trading signal to enhance trading confidence level.
Level 3 : comprehensive indicator/strategy. They are simple trading systems based on my strategies. They are commonly containing several or all of entry signal, close signal, stop loss, take profit, re-entry, risk management, and position sizing techniques. Even some interesting fundamental and mass psychological aspects are incorporated.
Level 4 : script snippets or functions that do not disclose source code. Interesting element that can reveal market laws and work as raw material for indicators and strategies. If you find Level 1~2 scripts are helpful, Level 4 is a private version that took me far more efforts to develop.
Level 5 : indicator/strategy that do not disclose source code. private version of Level 3 script with my accumulated script processing skills or a large number of custom functions. I had a private function library built in past two years. Level 5 scripts use many of them to achieve private trading strategy.

SWING DELTAThis will show the price change between the high/low of each candlestick as an oscillator with configurable options to show Long/Short or both.

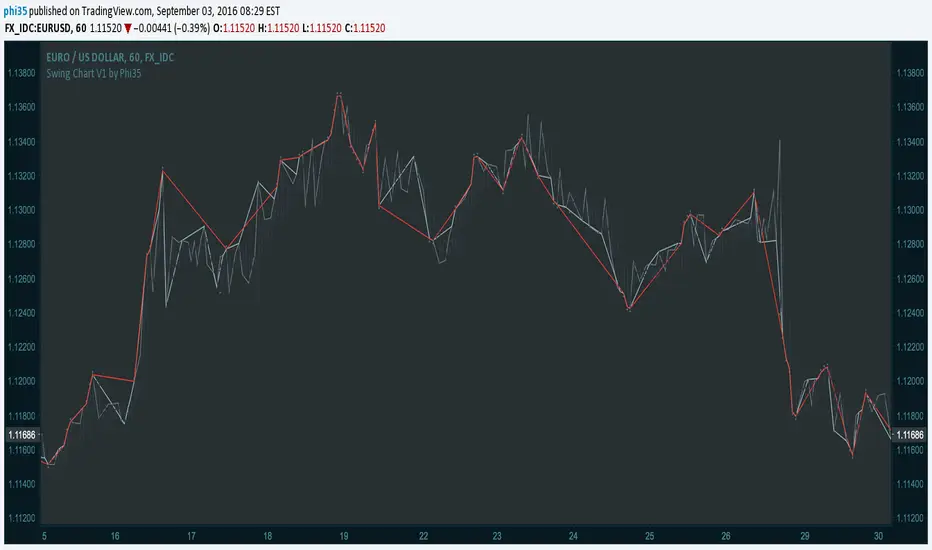
Swing Chart V1 by Phi35 © With this indicator, which plots the swing chart of the 3 degrees, swing traders can automate their work of tracking the right bars.
How it works:
Minor Degree (one bar) (gray)= If the current high is higher than the previous high or the current low is lower than the previous low.
Intermediate Degree (two bar) (baby blue)= If the current high is higher than previous and the penultimate high etc.
Main Degree (three bar) (red)= If the current high is higher than the previous, the penultimate and the high before penultimate high etc.
Alert:
On crossover there will be an alert (popup with a message) and in addition you will see "diamonds" on the place where the crossover took place
If there is an issue or any suggestions, feel free to contact me. Do not modify the code without permission.
Swing Chart V1 by Phi35 ©
JPY GBP ROCsRate of change of most volatile JPY and GBP pairs. All pairs ending in JPY are red except GBPJPY (colored yellow --currently most volatile 7/2016). GBPNZD is blue, the other GBP pairs are green, lime and teal. GBPJPY and GBPNZD are my favorite day trading / swing trading pairs. This script allows me to see the action of the most volatile and liquid pairs on one screen. JPY pairs (ex-GBPJPY) are all red so that I see the flow of JPY not so much each pair and its name. Global movement of JPY is what I am after. Same for the coloring of GBP pairs as green expect GBPNZD as blue. ***** EURGBP is plotted as an opposite (with a negative in front of its sma. EURGBP is extremely correlated to GBPNZD, I decided to plot it also.

MAGNUS® CyclesThis indicator will help you if you struggle making any profit in bitcoin.
It generates very few signals with very nice profit potential ( around 100% this year ! ).
Perfect tool for longterm swing traders and new traders that need help figuring out the midterm trend.
Use it with these parameters only:
weekly: 13, 5, 12
daily: 92, 21, 96
