FluxGate Daily Swing Strategy Summary in one paragraph
FluxGate treats long and short as different ecosystems. It runs two independent engines so the long side can be bold when the tape rewards upside persistence while the short side can stay selective when downside is messy. The core reads three directional drivers from price geometry then removes overlap before gating with clean path checks. The complementary risk module anchors stop distance to a higher timeframe ATR so a unit means the same thing on SPY and BTC. It can add take profit breakeven and an ATR trail that only activates after the trade earns it. If a stop is hit the strategy can re enter in the same direction on the next bar with a daily retry cap that you control. Add it to a clean chart. Use defaults to see the intended behavior. For conservative workflows evaluate on bar close.
Scope and intent
• Markets. Large cap equities and liquid ETFs major FX pairs US index futures and liquid crypto pairs
• Timeframes. From one minute to daily
• Default demo in this publication. SPY on one day timeframe
• Purpose. Reduce false starts without missing sustained trends by fusing independent drivers and suppressing activity when the path is noisy
• Limits. This is a strategy. Orders are simulated on standard candles. Non standard chart types are not supported for execution
Originality and usefulness
• Unique fusion. FluxGate extracts three drivers that look at price from different angles. Direction measures slope of a smoothed guide and scales by realized volatility so a point of slope does not mean a different thing on different symbols. Persistence looks at short sign agreement to reward series of closes that keep direction. Curvature measures the second difference of a local fit to wake up during convex pushes. These three are then orthonormalized so a strong reading in one does not double count through another.
• Gates that matter. Efficiency ratio prefers direct paths over treadmills. Entropy turns up versus down frequency into an information read. Light fractal cohesion punishes wrinkly paths. Together they slow the system in chop and allow it to open up when the path is clean.
• Separate long and short engines. Threshold tilts adapt to the skew of score excursions. That lets long engage earlier when upside distribution supports it and keeps short cautious where downside surprise and venue frictions are common.
• Practical risk behavior. Stops are ATR anchored on a higher timeframe so the unit is portable. Take profit is expressed in R so two R means the same concept across symbols. Breakeven and trailing only activate after a chosen R so early noise does not squeeze a good entry. Re entry after stop lets the system try again without you babysitting the chart.
• Testability. Every major window and the aggression controls live in Inputs. There is no hidden magic number.
Method overview in plain language
Base measures
• Return basis. Natural log of close over prior close for stability and easy aggregation through time. Realized volatility is the standard deviation of returns over a moving window.
• Range basis for risk. ATR computed on a higher timeframe anchor such as day week or month. That anchor is steady across venues and avoids chasing chart specific quirks.
Components
• Directional intensity. Use an EMA of typical price as a guide. Take the day to day slope as raw direction. Divide by realized volatility to get a unit free measure. Soft clip to keep outliers from dominating.
• Persistence. Encode whether each bar closed up or down. Measure short sign agreement so a string of higher closes scores better than a jittery sequence. This favors push continuity without guessing tops or bottoms.
• Curvature. Fit a short linear regression and compute the second difference of the fitted series. Strong curvature flags acceleration that slope alone may miss.
• Efficiency gate. Compare net move to path length over a gate window. Values near one indicate direct paths. Values near zero indicate treadmill behavior.
• Entropy gate. Convert up versus down frequency into a probability of direction. High entropy means coin toss. The gate narrows there.
• Fractal cohesion. A light read of path wrinkliness relative to span. Lower cohesion reduces the urge to act.
• Phase assist. Map price inside a recent channel to a small signed bias that grows with confidence. This helps entries lean toward the right half of the channel without becoming a breakout rule.
• Shock control. Compare short volatility to long volatility. When short term volatility spikes the shock gate temporarily damps activity so the system waits for pressure to normalize.
Fusion rule
• Normalize the three drivers after removing overlap
• Blend with weights that adapt to your aggression input
• Multiply by the gates to respect path quality
• Smooth just enough to avoid jitter while keeping timing responsive
• Compute an adaptive mean and deviation of the score and set separate long and short thresholds with a small tilt informed by skew sign
• The result is one long score and one short score that can cross their thresholds at different times for the same tape which is a feature not a bug
Signal rule
• A long suggestion appears when the long score crosses above its long threshold while all gates are active
• A short suggestion appears when the short score crosses below its short threshold while all gates are active
• If any required gate is missing the state is wait
• When a position is open the status is in long or in short until the complementary risk engine exits or your entry mode closes and flips
Inputs with guidance
Setup Long
• Base length Long. Master window for the long engine. Typical range twenty four to eighty. Raising it improves selectivity and reduces trade count. Lowering it reacts faster but can increase noise
• Aggression Long. Zero to one. Higher values make thresholds more permissive and shorten smoothing
Setup Short
• Base length Short. Master window for the short engine. Typical range twenty eight to ninety six
• Aggression Short. Zero to one. Lower values keep shorts conservative which is often useful on upward drifting symbols
Entries and UI
• Entry mode. Both or Long only or Short only
Complementary risk engine
• Enable risk engine. Turns on bracket exits while keeping your signal logic untouched
• ATR anchor timeframe. Day Week or Month. This sets the structural unit of stop distance
• ATR length. Default fourteen
• Stop multiple. Default one point five times the anchor ATR
• Use take profit. On by default
• Take profit in R. Default two R
• Breakeven trigger in R. Default one R
Usage recipes
Intraday trend focus
• Entry mode Both
• ATR anchor Week
• Aggression Long zero point five Aggression Short zero point three
• Stop multiple one point five Take profit two R
• Expect fewer trades that stick to directional pushes and skip treadmill noise
Intraday mean reversion focus
• Session windows optional if you add them in your copy
• ATR anchor Day
• Lower aggression both sides
• Breakeven later and trailing later so the first bounce has room
• This favors fade entries that still convert into trends when the path stays clean
Swing continuation
• Signal timeframe four hours or one day
• Confirm timeframe one day if you choose to include bias
• ATR anchor Week or Month
• Larger base windows and a steady two R target
• This accepts fewer entries and aims for larger holds
Properties visible in this publication
• Initial capital 25.000
• Base currency USD
• Default order size percent of equity value three - 3% of the total capital
• Pyramiding zero
• Commission zero point zero three percent - 0.03% of total capital
• Slippage five ticks
• Process orders on close off
• Recalculate after order is filled off
• Calc on every tick off
• Bar magnifier off
• Any request security calls use lookahead off everywhere
Realism and responsible publication
• No performance promises. Past results never guarantee future outcomes
• Fills and slippage vary by venue and feed
• Strategies run on standard candles only
• Shapes can update while a bar is forming and settle on close
• Keep risk per trade sensible. Around one percent is typical for study. Above five to ten percent is rarely sustainable
Honest limitations and failure modes
• Sudden news and thin liquidity can break assumptions behind entropy and cohesion reads
• Gap heavy symbols often behave better with a True Range basis for risk than a simple range
• Very quiet regimes can reduce score contrast. Consider longer windows or higher thresholds when markets sleep
• Session windows follow the exchange time of the chart if you add them
• If stop and target can both be inside a single bar this strategy prefers stop first to keep accounting conservative
Open source reuse and credits
• No reused open source beyond public domain building blocks such as ATR EMA and linear regression concepts
Legal
Education and research only. Not investment advice. You are responsible for your decisions. Test on history and in simulation with realistic costs
Swingtradingsetup
CNagda-MomentumX - Institutional FlowMomentumX is designed to empower traders with a deeper understanding of market movements by focusing on Institutional Flow and advanced market structure analytics. The core goal is to identify and visualize where major market participants are operating, and to translate these complex footprints into clear, actionable trading signals — all in real time.
Real-time institutional activity mapping
Actionable entry and exit signals based on live market structure
Intuitive dashboard and dynamic chart visuals
Fully customizable modules for trend, liquidity, and order blocks
Core Logic Design
At the heart of MomentumX lies a robust algorithmic engine built to capture and surface institutional trading behavior. By leveraging advanced mathematical models, the indicator calculates institutional volume ratios and price momentum to pinpoint aggressive moves from large participants.
Institutional Volume & Price Momentum:
Utilizes custom volume indicators and price change analysis to detect strong buying or selling pressure, filtering out retail noise.
Liquidity Grab Detection & Activity Zones:
The script identifies liquidity grabs by monitoring abrupt price sweeps at major support/resistance levels—often where institutions trigger stop hunts or reversals. All critical activity zones are automatically color-coded on the chart for instant recognition.
Dashboard Visualization:
A fully dynamic dashboard table overlays live scores for accumulation, distribution, strength, and weakness—giving traders a real-time scan of market health.
Trendline & Order Block Architecture:
The logic auto-detects pivot highs/lows to draw smart trendlines, while the order block system highlights key reversal areas and breaker zones—making market structure clear and actionable.
MomentumX is packed with high-performance modules, each engineered to simplify complex market behavior and enhance decision-making for traders:
Institutional Flow Signals:
Instantly identifies spots where institutional players drive momentum, using unique volume and price activity analytics.
Bullish/Bearish Liquidity Grab Detection:
Marks abrupt price moves that signal stop hunts or reversals, letting traders anticipate snap-backs or trend shifts.
Trendline Auto-Detection:
Smartly draws trendlines based on significant swing highs and lows, automatically adjusting as price evolves.
Order Block System (Rejection/Breaker):
Spots and highlights key reversal zones with order block rectangles, confirming rejections or breakouts at strategic levels.
Dashboard and Bar Coloring:
A clean dashboard overlay presents live market scores, while dynamic bar coloring makes trend, strength, and high-activity periods instantly visible.
User Input Toggles for Each Module:
Every major feature is fully customizable—enable or disable modules to match individual trading setups or preferences.
Scripting/Development
MomentumX’s scripting process is modular, enabling clarity, scalability, and fast optimization throughout development:
Initialization & Inputs:
Start by defining all user input options, module toggles, color settings, and calculation parameters—ensuring maximum flexibility early on.
Core Calculation Functions:
Script advanced institutional volume and price momentum algorithms. Build out swing length logic, market state filters, and activity scoring methods.
Detection Engines:
Develop and integrate engines for liquidity grabs, automated trendline detection, and order block identification—each with dedicated functions for speed and precision.
Visual Overlays & Plotting:
Implement powerful plotting logic for colored bars, score dashboards, trendlines, reversal zones, and liquidity markers—making every data point clear and actionable on the chart.
Testing Handlers:
Add diagnostic panels and debug outputs to refine calculations and assure accuracy in every market environment.
Sample Trade Setups (Usage)
Cnagda MomentumX delivers clarity for multiple trading styles by providing timely, actionable setups grounded in institutional behavior and market structure. Here’s how traders can leverage the indicator for confident decision-making:
Liquidity Grab Reversal
Enter trades around detected liquidity grabs when price sweeps major support/resistance and the dashboard signals a momentum shift.
Example: Wait for a bullish/Bearish grab near market lows/high, with institutional flow turning positive/negative—enter long/short for potential mean reversion.
Order Block Breakout
Trade breakouts when price cleanly rejects or flips key order block zones highlighted on the chart.
Example: Short at a marked breaker block after a rejection signal, confirmed by a downward institutional activity spike.
Trendline Continuation
Ride established market moves by entering on trendline confirmations plotted by the auto-detect system.
Example: Go long after a trendline retest, confirmed by a green bar color and dashboard strength score.
Dashboard Confirmation
Combine dashboard metrics (strength, accumulation, distribution) with bar color overlays for multi-factor entries.
Example: Enter trades only when all market signals align in real time for maximum probability.
For Short Entry check -- Weakness : For Long Entry Check - Strength With Other Indications
MomentumX is not just another indicator – it’s your edge for reading the market like an insider. By transparently mapping institutional flow, uncovering hidden liquidity zones, and color-coding every major structure shift, MomentumX transforms complexity into actionable clarity. Whether you’re scalping, swing trading, or investing, you’ll gain a decisive, real-time advantage on every chart.
Embrace smarter decisions, adapt to changing market conditions instantly, and join a new generation of technically empowered traders.
Customize, observe, and let the market reveal opportunities in a way you’ve never experienced before.
Happy Trading
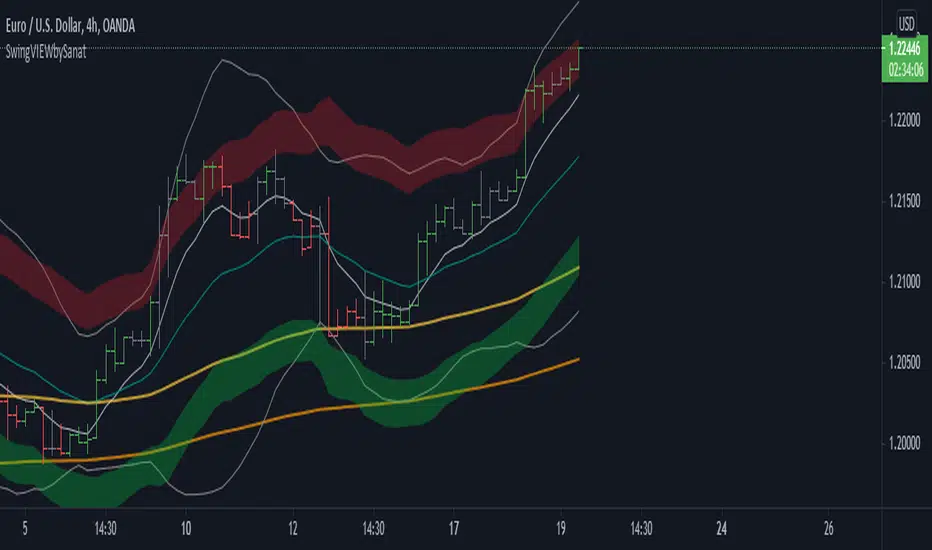
SVIEWThis is momentum based indicator
Input
1. Two EMA
2. Stochastic
Thought process
1. Difference between fast and slow ema has a oscillating nature.
2. Stochastic %k %d crossover gives early signals
3. early entry gives low risk high reward setup
Calculation
1. A= EMA (fast) - EMA (slow)
2. B =Stochastic(%K)-Stochastic(%D)
When A is increasing and B is positive, bar is green
When A is decreasing and B is negative, bar is red
Else, bar is black
Use
This is an early entry signal system. When used with Channel trading system, it gives high probability, low risk high reward setups
Example
When price has breached below -2 Keltner channel, and impulse candle turns green, go long (or sell put options )
29 minutes ago
Release Notes:
This is combination of
1. Ema diff
2. stochastic
3. Keltner channel
4. Bollinger bands
5. bunch of EMAs
Thought process
1. Difference between fast and slow ema has a oscillating nature.
2. Stochastic %k %d crossover gives early signals
3. early entry gives low risk high reward setup
Calculation
1. A= EMA (fast) - EMA (slow)
2. B =Stochastic(%K)-Stochastic(%D)
When A is increasing and B is positive, bar is green
When A is decreasing and B is negative, bar is red
Else, bar is black
Use
This is an early entry signal system. When used with Channel trading system, it gives high probability, low risk high reward setups
Example
When price has breached below -2 Keltner channel, and impulse candle turns green, go long (or sell put options )
Bollinger %B Candles StrategyStrategy built based on earlier published indicator:
Looks to be doing good for short term swing trades. But, I am not sure if there is repainting. I tried to avoid buy/sell trades on same day - but wasn't successful.
So far back-tested on following:
COINBASE:BTCUSD - works on both long and short
CURRENCYCOM:GOLD and equities - long only.
Some of the failures: ASX:WPL , ASX:WHC , ASX:NHC
As usual for back-testing - using 1000 as initial capital with 100% invested on each trade and no compounding so that it will be easy to compare with buy and hold. Trade with caution :)