MACD Bands - Multi Timeframe [TradeMaster Lite]We present a customizable MACD indicator, with the following features:
Multi-timeframe
Deviation bands to spot unusual volatility
9 Moving Average types
Conditional coloring and line crossings
👉 What is MACD?
MACD is a classic, trend-following indicator that uses moving averages to identify changes in momentum. It can be used to identify trend changes, overbought and oversold conditions, and potential reversals.
👉 Multi-timeframe:
This feature allows to analyze the same market data on multiple time frames, which can be in help to identify trends and patterns that would not be visible on a single time frame. When using the multi-timeframe feature, it is important to start with the higher time frame and then look for confirmation on the lower time frames. This will help you to avoid false signals. Please note that only timeframes higher than the chart timeframe is supported currently with this feature enabled. Might get updated in the future.
👉 Deviation bands to spot unusual volatility:
Deviation bands are plotted around the Signal line that can be in help to identify periods of unusual volatility. When the MACD line crosses outside of the deviation bands, it suggests that the market is becoming more volatile and a strong trend may form in that direction.
👉 9 Moving Average types can be used in the script. Each type of moving average offers a unique perspective and can be used in different scenarios to identify market trends.
SMA (Simple Moving Average): This calculates the average of a selected range of values, by the number of periods in that range.
SMMA (Smoothed Moving Average): This takes into account all data available and assigns equal weighting to the values.
EMA (Exponential Moving Average): This places a greater weight and significance on the most recent data points.
DEMA (Double Exponential Moving Average): This is a faster-moving average that uses a proprietary calculation to reduce the lag in data points.
TEMA (Triple Exponential Moving Average): This is even quicker than the DEMA, helping traders respond more quickly to changes in trend.
LSMA (Least Squares Moving Average): This moving average applies least squares regression method to determine the future direction of the trend.
HMA (Hull Moving Average): This moving average is designed to reduce lag and improve smoothness, providing quicker signals for short-term market movements.
VWMA (Volume Weighted Moving Average): This assigns more weight to candles with a high volume, reflecting the true average values more accurately in high volume periods.
WMA (Weighted Moving Average): This assigns more weight to the latest data, but not as much as the EMA.
👉 Conditional coloring :
This feature colors the MACD line line based on it's direction and fills the area between the MACD line and Deviation band edges to highlight the potential volatility and the strength of the momentum. This can be useful to identify when the market is trending strongly and when it is in a more neutral or choppy state.
👉 MACD Line - Signal Line crossings:
This is a classic MACD trading signal that occurs when the MACD line crosses above or below the signal line. Crossovers can be used to identify potential trend reversals. This can be a bullish or bearish signal, depending on the direction of the crossover.
👉 General advice
Confirming Signals with other indicators:
As with all technical indicators, it is important to confirm potential signals with other analytical tools, such as support and resistance levels, as well as indicators like RSI, MACD, and volume. This helps increase the probability of a successful trade.
Use proper risk management:
When using this or any other indicator, it is crucial to have proper risk management in place. Consider implementing stop-loss levels and thoughtful position sizing.
Combining with other technical indicators:
The indicator can be effectively used alongside other technical indicators to create a comprehensive trading strategy and provide additional confirmation.
Keep in Mind:
Thorough research and backtesting are essential before making any trading decisions. Furthermore, it's crucial to have a solid understanding of the indicator and its behavior. Additionally, incorporating fundamental analysis and considering market sentiment can be vital factors to take into account in your trading approach.
Limitations:
This is a lagging indicator. Please note that the indicator is using moving averages, which are lagging indicators.
The indicators within the TradeMaster Lite package aim for simplicity and efficiency, while retaining their original purpose and value. Some settings, functions or visuals may be simpler than expected.
⭐ Conclusion
We hold the view that the true path to success is the synergy between the trader and the tool, contrary to the common belief that the tool itself is the sole determinant of profitability. The actual scenario is more nuanced than such an oversimplification. Our aim is to offer useful features that meet the needs of the 21st century and that we actually use.
🛑 Risk Notice:
Everything provided by trademasterindicator – from scripts, tools, and articles to educational materials – is intended solely for educational and informational purposes. Past performance does not assure future returns.
TA

TaLib RSI (ta-lib uses SMA)If you've ever been confused because Ta-Lib RSI differs from TradingView's RSI...
Look no further than here which instead of using the Rolling Moving Average, will instead use the Simple Moving Average

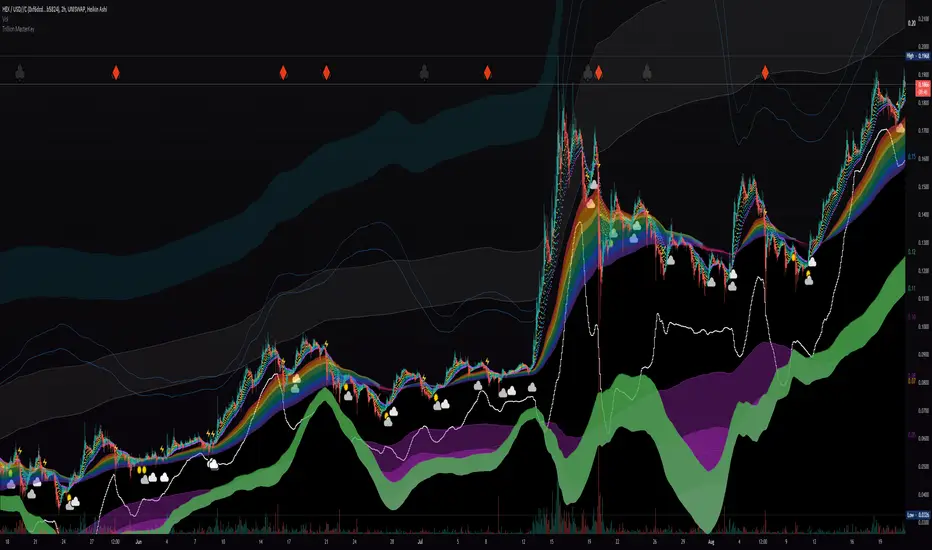
Liquidity Rainbow - Trillion ResearchThis indicator uses regression along with RSI and moving averages from multiple time frames to help you visualize the market in a single view. After learning the notations, you will be able to identify pockets of liquidity and determine high/low probability price zones without drawing a single line.
Booster symbols help confirm short term trends and breakouts based off of two waveform functions, one long period, the other with a much shorter period. You get the buy signal that everyone else sees plus the confirmation!
This is a system that is not fully developed, PNL is not available yet. Strategy version is coming soon, still back testing.
I am tuning this model for crypto specifically, although it works for anything with a price chart.
2 EMAs (configurable to MA)
Dragonskin - RGB circle plots eMA
Rainbow - RGB area plots eMA
+When you see the rainbow appear it means that the price is above the slowest ema baseline. Generally bullish as price tends to ride the rainbow. Ideally, you will see a white cloud at the origin.
-When you see white step line cutting into the upper colors of the rainbow.
Once the price has traded below the rainbow for the FIRST time, not just wicked. You can set a target that's just above the previous high bodys above the rainbow. Do not sell the dip, let the floppers flop.
The second time price cuts down through a thick rainbow is usually bearish .
What makes me so sure? Liquidity
In order to be successful, we need to understand liquidity, the juiciest pockets of profit.
I will reveal more of the strategy in the second script.
For now, use:
SUN symbol - Notice how the price always seems to come back and sweep up any SUNs that get left behind (up and down) this is a liquidity nugget
CLOUD(s) indicators of support. Meaning that on ema trend we expect a lower price but each time that happens, it gets bought up above baseline. weak->strong (little gray - light blue - white)
LIGHTNING indicator of resistance. Meaning the price is not being allowed to recover, each time it rises above baseline, it is sold down again.
YELLOW CROSS - Classically known as a whale manipulation indicator. It tends to indicate a strong bearish move incoming or the reversal of an ongoing bearish move. There's dumping. "Get ready something is happening" indicator.
HEARTS = BUY
SPADES = Buy
CLUBS = Sell
DIAMONDS = SELL
*do not use these during periods of consolidation. consolidation is a period when the price swings in both directions but not too much. In a narrow range the indicators can pop up.
Why does this happen?
Short periods, during which exchanges stabilize the prices, are necessary for the redistribution of assets over the course of trading. Sometimes they happen multiple times a week and can last 24 or 48hours. Also it is a great time to eat up algo traders and that's why you'll see noise.
You want to focus on the period immediately following a consolidations. Don't rush it, they really do take 20 hours+
If you realize that you are in one of these consolidation ranges, limit order the tips of the wicks, nothing in the middle. There is not much profit here but also there is minimal risk.
If you're confirmed in a consolidation, exchanges will work to buoy the price to the appropriate mark price even if there is a big buy/sell order. A lot of time price will go up the congruent amount afterwards to compensate the toxic vwap .
I hope this helps people see the bigger picture and become even more successful with bigger gains.
I've tested this on all the major cryptos. Bitcoin BTC Ethereum ETH HEX
Honestly, I have tested very few stonks with this, later.
-Market Enemy
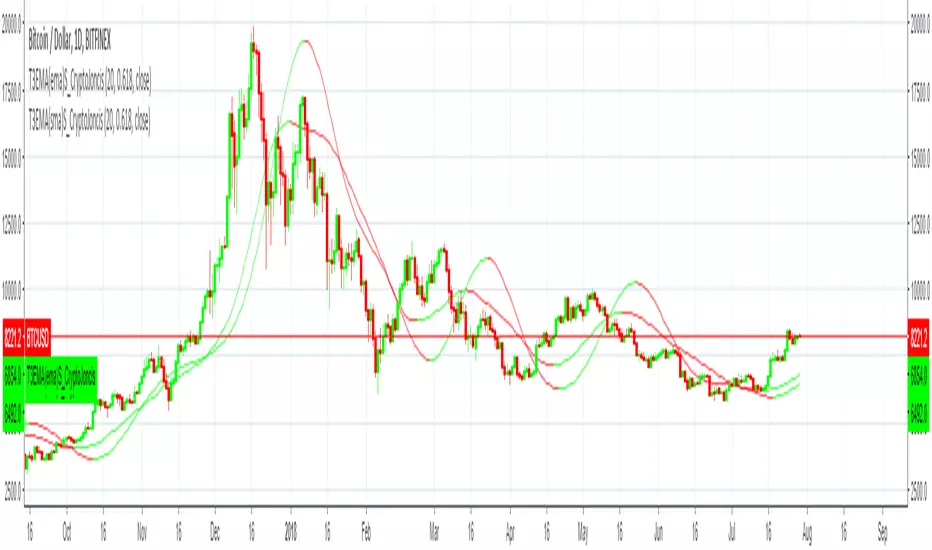
Tillson Moving Average(ema) TENT3 Moving Average indicator was originally developed by Tim Tillson in 1998/99.
T3 Moving Average is considered as improved and better to traditional moving averages as it is smoother and performs better in trending market conditions.
It offers multiple opportunities when the price is in the state of retracement and therefore allows to minimize your exposed risk and allowing your profits run.
This version provides simple T3 MA
Source options - all standard + HA
T3 based on 6x ema
Can add up to 10 T3 MA on chart
Consider a tip in ETH to
0xac290B4A721f5ef75b0971F1102e01E1942A4578
Thank you and have a nice day
CryptoJoncis

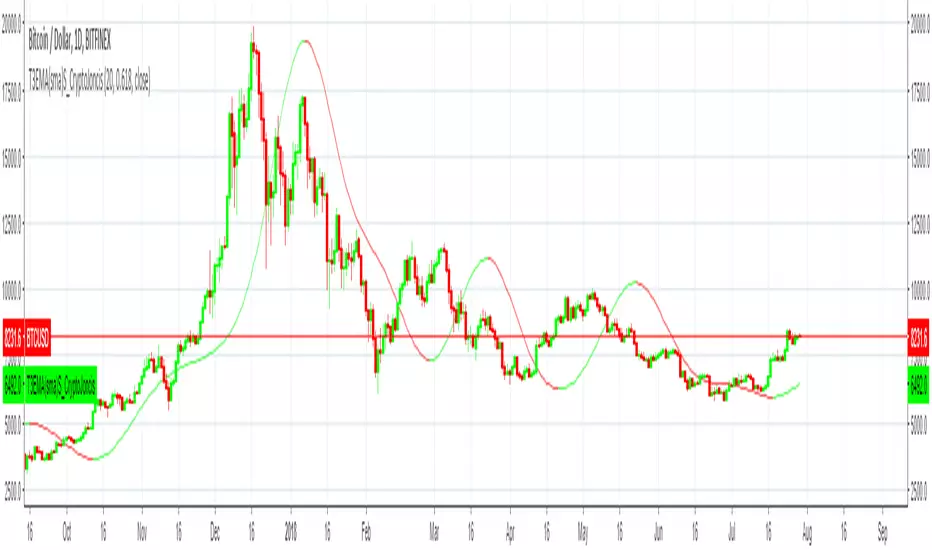
Tillson Moving Average(vwma) singleT3 Moving Average indicator was originally developed by Tim Tillson in 1998/99.
T3 Moving Average is considered as improved and better to traditional moving averages as it is smoother and performs better in trending market conditions.
It offers multiple opportunities when the price is in the state of retracement and therefore allows to minimize your exposed risk and allowing your profits run.
This version provides simple T3 MA
Source options - all standard + HA
T3 based on 6x vwma
Only adds 1 T3 MA on chart
Consider a tip in ETH to
0xac290B4A721f5ef75b0971F1102e01E1942A4578
Thank you and have a nice day
CryptoJoncis

Tillson Moving Average(swma) singleT3 Moving Average indicator was originally developed by Tim Tillson in 1998/99.
T3 Moving Average is considered as improved and better to traditional moving averages as it is smoother and performs better in trending market conditions.
It offers multiple opportunities when the price is in the state of retracement and therefore allows to minimize your exposed risk and allowing your profits run.
This version provides simple T3 MA
Source options - all standard + HA
T3 based on 6x swma
Only adds 1 T3 MA on chart
Consider a tip in ETH to
0xac290B4A721f5ef75b0971F1102e01E1942A4578
Thank you and have a nice day
CryptoJoncis

Tillson Moving Average(alma) singleT3 Moving Average indicator was originally developed by Tim Tillson in 1998/99.
T3 Moving Average is considered as improved and better to traditional moving averages as it is smoother and performs better in trending market conditions.
It offers multiple opportunities when the price is in the state of retracement and therefore allows to minimize your exposed risk and allowing your profits run.
This version provides simple T3 MA
Source options - all standard + HA
T3 based on 6x alma
Only adds 1 T3 MA on chart
Consider a tip in ETH to
0xac290B4A721f5ef75b0971F1102e01E1942A4578
Thank you and have a nice day
CryptoJoncis

Tillson Moving Average(wma) singleT3 Moving Average indicator was originally developed by Tim Tillson in 1998/99.
T3 Moving Average is considered as improved and better to traditional moving averages as it is smoother and performs better in trending market conditions.
It offers multiple opportunities when the price is in the state of retracement and therefore allows to minimize your exposed risk and allowing your profits run.
This version provides simple T3 MA
Source options - all standard + HA
T3 based on 6x wma
Only adds 1 T3 MA on chart
Consider a tip in ETH to
0xac290B4A721f5ef75b0971F1102e01E1942A4578
Thank you and have a nice day
CryptoJoncis

Tillson Moving Average(rma) singleT3 Moving Average indicator was originally developed by Tim Tillson in 1998/99.
T3 Moving Average is considered as improved and better to traditional moving averages as it is smoother and performs better in trending market conditions.
It offers multiple opportunities when the price is in the state of retracement and therefore allows to minimize your exposed risk and allowing your profits run.
This version provides simple T3 MA
Source options - all standard + HA
T3 based on 6x rma
Only adds 1 T3 MA on chart
Consider a tip in ETH to
0xac290B4A721f5ef75b0971F1102e01E1942A4578
Thank you and have a nice day
CryptoJoncis

Tillson Moving Average(sma) singleT3 Moving Average indicator was originally developed by Tim Tillson in 1998/99.
T3 Moving Average is considered as improved and better to traditional moving averages as it is smoother and performs better in trending market conditions.
It offers multiple opportunities when the price is in the state of retracement and therefore allows to minimize your exposed risk and allowing your profits run.
This version provides simple T3 MA
Source options - all standard + HA
T3 based on 6x sma
Only adds 1 T3 MA on chart
Consider a tip in ETH to
0xac290B4A721f5ef75b0971F1102e01E1942A4578
Thank you and have a nice day
CryptoJoncis
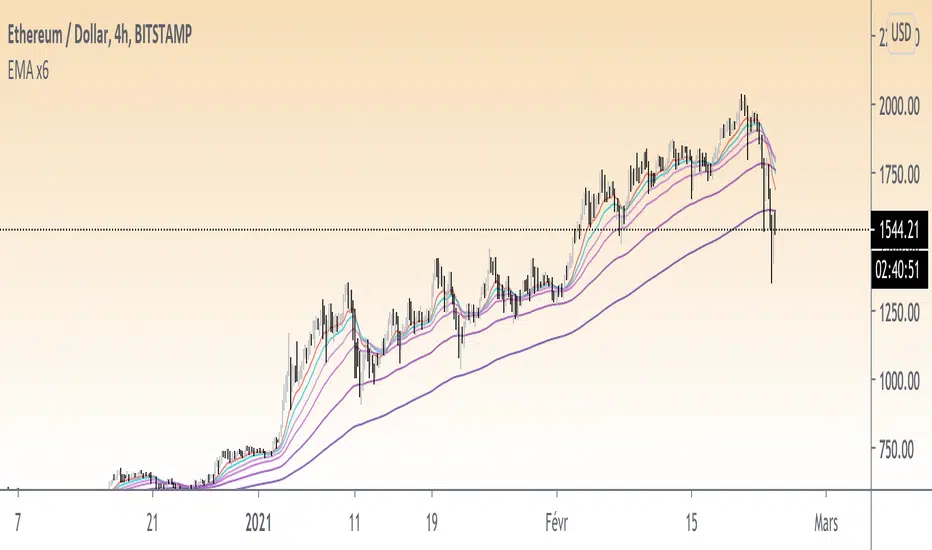
Multi EMAI really like to work with EMAs, but each time you use the "buit-in" one, you use one more slot in your indicators allowed.
So I built this simple one, 4 EMA in one indicator, and easy to use as following;
-displays 4 EMAs
-choose your EMA lenghts. bases are 20;50;100;200
-choose your color and other options as needed.
Hope you will enjoy it, and I will appreciate your feedback, and improvement suggestions.
KCWThis TA is called Keltner Channel Width(KCW). It consists of a black line measuring the percentage difference between the upper and the lower channel and a blue line which is the 20-sma of KCW. Based on true range, KCW can be interpreted in two ways: (1) falling width reflects decreasing volatility and (2) rising width reflects increasing volatility.
KCW is a powerful weapon for identifying The Squeeze. This occurs when volatility falls to a very low level, as evidenced by decresing value (negative crossover). After a Squeeze, might be a positive crossover, it signals the start of a new move. A new advance starts with a Squeeze and subsequent break above the upper channel. A new decline starts with a Squeeze and subsequent break below the lower channel.
Done for today. Look forward to your comments and most importantly, your subscription.
Lonelygrass

EMA RatioThis system is called " EMA Ratio" . Using a special formula developed by myself, I have developed it in a view to spot trading opportunities of trend following or counter-trend.
Blue line in the TA means positive growth in prices of a security. A reading higher than 1 is somehow an indication of prices making higher highs, but in the meantime watch out for a decline in its readings, which may imply the uptrend is fading or reversing. It is just the opposite for the red line, which means negative growth in prices.
Traders can stick to either one lines, or both of them, and look for crossover signals. To make this more convenient, crossing alert is already set up. Hope you will find it helpful. Appreciate likes and comments!

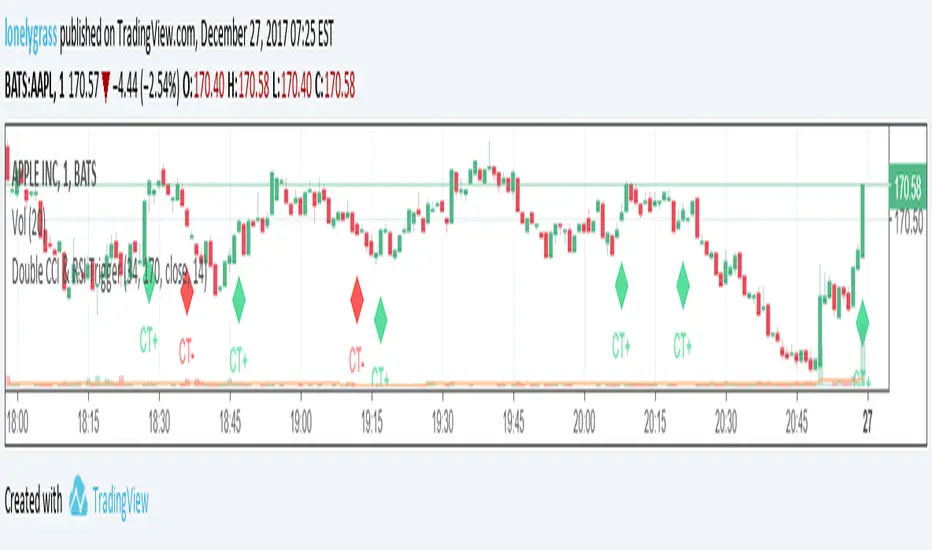
Double CCI & RSI TriggerWarning : This strategy can only be implemented with 1 minute timeframe chart
With the help of 2 CCI and 1 RSI, it is much easier to identify the market trend. The main idea of this EA is looking at a longer CCI (170 periods) and RSI (14 periods) and finding some possible bullish and bearish trends.
Bullish Conditions: 170 CCI has a value of above 0 and RSI 14 is larger than 30 (oversold)
Bearish Conditions: 170 CCI has a value of below 0 and RSI 14 is lower than 70 (overbought)
When conditions are met, CT+ (bullish) and CT- (bearish) signals will be shown on the graph.
To effectively adopt the system, users have to incorporate "Double CCI & RSI Alert" , my another script, into this and can decide whether or not to hold onto positions. Happy trading! Appreciate support and comments!
Trade Archer - Moving Averages - v1A group of four moving averages used for price smoothing. It also creates a cloud between Fast Ma and Medfast MA, Medfast MA and Medslow MA, and Medslow MA and Slow MA. Originally only Exponential Moving Averages were available, however the option to choose SMA, EMA (default), RMA, WMA, and VWMA were added. Also added was the option to choose the source of input. If any interesting additions are added, please let me know so I can update the script.
