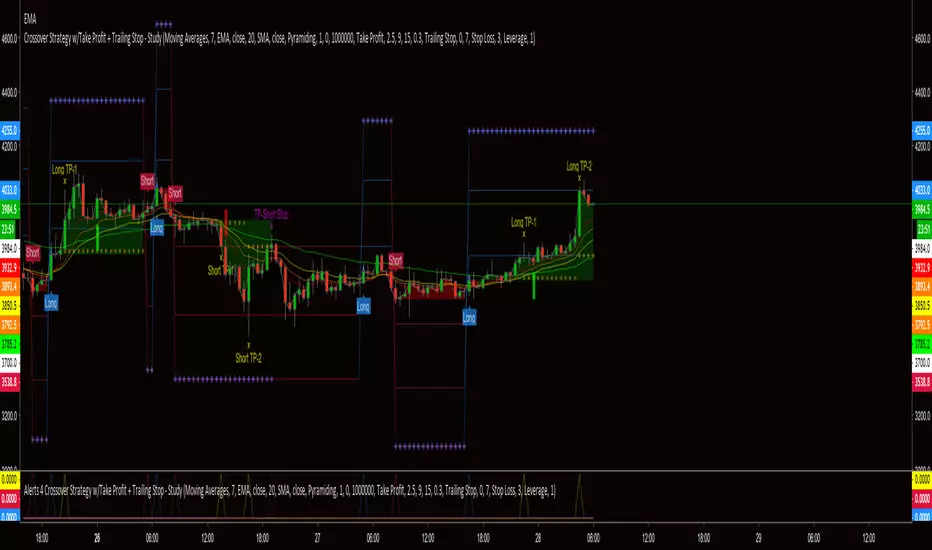
Crossover Strategy w/Take Profit + Trailing Stop - StudyThis script is a result of hours of trail, error and research. If something is not functioning as anticipated, please notify me with a description and possible screen shot of the issue.
The strategy is a basic crossover strategy. When MA1 crosses above MA2, it will trigger a long entry. When MA1 crosses below MA2, it will trigger a short entry.
When using the Take Profit function, the trailing stop will automatically activate at the defined TP3 level.
Also, when TP1 is hit a stop loss is set at 0.3% (this can be adjusted in settings) above/below the current entry. When TP2 is achieved, the stop will move up to the TP1 level.
If the trailing stop locks in LESS profit than the TP2 level, the stop will trigger at the TP2 level. This will continue until the trailing stop has moved to a level more advantageous than TP2.
There is a companion Alerts script for use with AutoView.
***AutoView syntax IS NOT provided***
Takeprofit
[ALERTS]Super-Trend & SL/TP V3This simple script analyzes the trend in real time...
Alerts, SL, TP, bla, bla, bla...

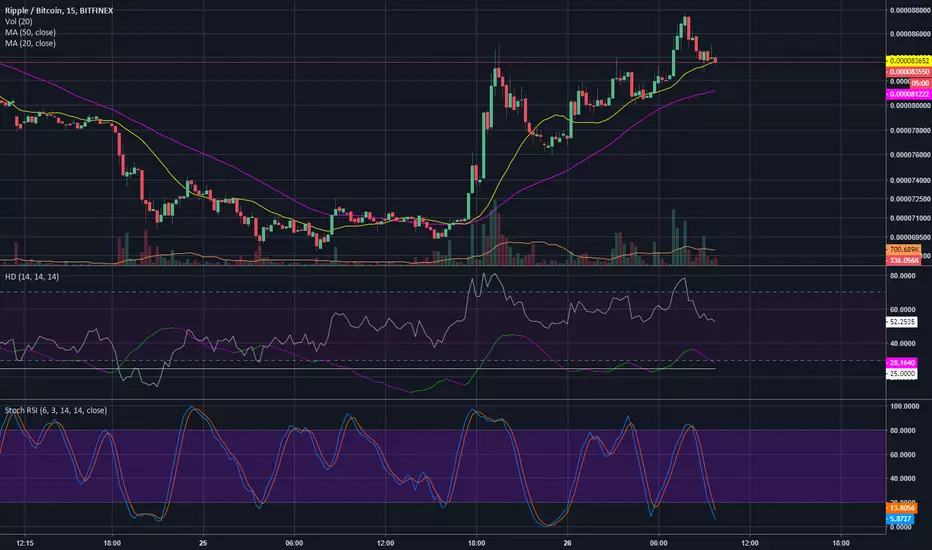
Hogland DivergenceThis is a good take profit indicator, a divergence on RSI (white line) followed by a reversal of green line into purple indicates the top (or bottom) of a trend.
lamBOTghini-ALERTador & SL/TP V3I publish the code again in case someone is interested in learning. I am not an expert, I learned from others who published their scripts and for this reason I do the same.
If someone tries to sell you a script it is because they do not make money with it in trading and they need to sell it to earn something.
It is a simple combination algorithm of 3 EMA with stop loss and Take profit and with alerts.
Enjoy!
¡Mucho ánimo a los Venezolanos!
¡Saludos desde España!

The Falcon v2 [SETUP]Hello,
as requested here is the setup version of my previous script. Works perfectly for automatic trading using buy and sell simple strategy.
The indicator is built upon RSI , EMAs and some other personnal tricks so predict trends.
I coded a stop loss and take profit system : you have to set up the script parameters before creating the alert.
As usual I am selling access to the script, with a trial for those who want to test first. I am also open to development or reverse engineering commissions.

Take Profit Again Trend Score(Crpto Catcher)_BinanceTPA SCORE_BINANCE ver
또땃 스코어 바이낸스 ver
------------------------------------------------------------------------------
This indicator is designed to find coins that are strong in market conditions.
It is recommended that users have an understanding of basic charts.
Careful investment is needed after the trend of the score itself has been on the downward trend.
Coins usually give the strongest return that run at the top of the score.
The realization of the profit on the chart must be done by the person himself.
When purchasing coins at the top of the score chart, we recommend the number of sheets at the adjustment point on the chart.
Because this index is a trend score, you may not be able to catch the start wave. To do this, use a starting wave catcher.
The coins listed in this index are coins of the highest rank in order of trading volume and will be updated at regular intervals.
At last year's rise of coin, it is based on catching light coin, Qtum, ripple, Ada, Stella, Tron rise.
Indicator vouchers will only be available to a small number of paid subscribers.
Thank you.
---------------------------------------------------------------------------------------------
이 지표는 시장 상황에서 강세를 띠는 코인을 찾아내기 위해 만들어 졌습니다.
기본적인 차트에 대한 이해가 있는 사용자가 사용하길 권합니다.
스코어자체의 추세가 하향을 한 이후는 신중한 투자가 필요합니다.
통상 가장 강한 수익을 주는 코인이 스코어 최상단을 달립니다.
차트상의 수익실현은 본인이 직접 수행해야 합니다.
통상 스타팅 파동을 잡아내는 스타팅 파동 캐쳐와 함께 사용합니다.
스코어차트상 최상단의 코인을 매수 할 시 차트상 조정지점에서 매수를 권합니다.
본 지표는 트렌드 점수 이기 때문에 시작 파동을 잡아내지 못할 수 있습니다.
이를 위해선 스타팅웨이브 캐쳐를 함께 사용합니다.
본 지표에 나와있는 코인들은 거래량순으로 상위등급의 코인들이며 일정 간격으로 업데이트 될 것입니다.
작년 코인상승장에서, 라이트코인,Qtum,리플,에이다,스텔라,트론 상승을 잡아낸 기반지표 입니다.
지표 이용권은 소수의 유료 구독 사용자들에게만 공개될 예정입니다.
감사합니다.

SL/TP assistantThis is a simple script to quickly see changes in % in each candle.
In blue open/close variation. In red Histogram with range between high and low.
This helps me understand very quickly what's the typical change in % for a specific timeframe/pair, so I can fine tune my Stop Losses and Take Profits.

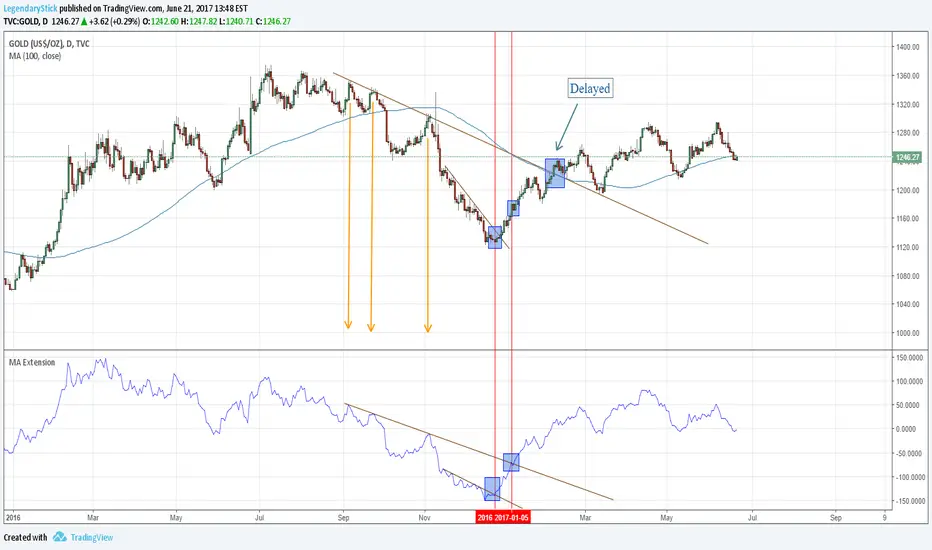
MA ExtensionThis indicator measures the vertical distance form the current close to the MA of your choice. I find that it does not work best as an oscillator, but it works well for providing early signals for taking profits when trend continuating. For example, if you go short due to a retracement to the MA (of your choice) take profits when a bearish trendline is broken (signalling the start of a bullish correction) that corresponds to the highs of the chart. The logic behind this indicator is that the breakouts of trendlines of an assets difference from an MA will precede corresponding breakouts of trendlines drawn on raw price. Kind of like Momentum, except it takes trend into account. Momentum has the same leading feature when it comes to drawing trendlines , but trendlines will be harder to draw due to the Momentum indicators oscillatory behavior.
MA ExtensionThis indicator measures the vertical distance form the current close to the MA of your choice. I find that it does not work best as an oscillator, but it works well for providing early signals for taking profits when trend continuating. For example, if you go short due to a retracement to the MA (of your choice) take profits when a bearish trendline is broken (signalling the start of a bullish correction) that corresponds to the highs of the chart. The logic behind this indicator is that the breakouts of trendlines of an assets difference from an MA will precede corresponding breakouts of trendlines drawn on raw price. Kind of like Momentum, except it takes trend into account. Momentum has the same leading feature when it comes to drawing trendlines , but trendlines will be harder to draw due to the Momentum indicators oscillatory behavior.

Hyper TrendHyper Trend can help you with setting your stop loss and take profit levels and shows if exisiting price levels are in long zone or short zone. Tune the indicator first for the chart you intend to use Hyper Trend on with the given options. Enjoy !
PS: Multiplier 2 gives results similar to the famous Super Trend indicator developed by Olivier Seban.
