Ensemble Alerts█ OVERVIEW
This indicator creates highly customizable alert conditions and messages by combining several technical conditions into groups , which users can specify directly from the "Settings/Inputs" tab. It offers a flexible framework for building and testing complex alert conditions without requiring code modifications for each adjustment.
█ CONCEPTS
Ensemble analysis
Ensemble analysis is a form of data analysis that combines several "weaker" models to produce a potentially more robust model. In a trading context, one of the most prevalent forms of ensemble analysis is the aggregation (grouping) of several indicators to derive market insights and reinforce trading decisions. With this analysis, traders typically inspect multiple indicators, signaling trade actions when specific conditions or groups of conditions align.
Simplifying ensemble creation
Combining indicators into one or more ensembles can be challenging, especially for users without programming knowledge. It usually involves writing custom scripts to aggregate the indicators and trigger trading alerts based on the confluence of specific conditions. Making such scripts customizable via inputs poses an additional challenge, as it often involves complicated input menus and conditional logic.
This indicator addresses these challenges by providing a simple, flexible input menu where users can easily define alert criteria by listing groups of conditions from various technical indicators in simple text boxes . With this script, you can create complex alert conditions intuitively from the "Settings/Inputs" tab without ever writing or modifying a single line of code. This framework makes advanced alert setups more accessible to non-coders. Additionally, it can help Pine programmers save time and effort when testing various condition combinations.
█ FEATURES
Configurable alert direction
The "Direction" dropdown at the top of the "Settings/Inputs" tab specifies the allowed direction for the alert conditions. There are four possible options:
• Up only : The indicator only evaluates upward conditions.
• Down only : The indicator only evaluates downward conditions.
• Up and down (default): The indicator evaluates upward and downward conditions, creating alert triggers for both.
• Alternating : The indicator prevents alert triggers for consecutive conditions in the same direction. An upward condition must be the first occurrence after a downward condition to trigger an alert, and vice versa for downward conditions.
Flexible condition groups
This script features six text inputs where users can define distinct condition groups (ensembles) for their alerts. An alert trigger occurs if all the conditions in at least one group occur.
Each input accepts a comma-separated list of numbers with optional spaces (e.g., "1, 4, 8"). Each listed number, from 1 to 35, corresponds to a specific individual condition. Below are the conditions that the numbers represent:
1 — RSI above/below threshold
2 — RSI below/above threshold
3 — Stoch above/below threshold
4 — Stoch below/above threshold
5 — Stoch K over/under D
6 — Stoch K under/over D
7 — AO above/below threshold
8 — AO below/above threshold
9 — AO rising/falling
10 — AO falling/rising
11 — Supertrend up/down
12 — Supertrend down/up
13 — Close above/below MA
14 — Close below/above MA
15 — Close above/below open
16 — Close below/above open
17 — Close increase/decrease
18 — Close decrease/increase
19 — Close near Donchian top/bottom (Close > (Mid + HH) / 2)
20 — Close near Donchian bottom/top (Close < (Mid + LL) / 2)
21 — New Donchian high/low
22 — New Donchian low/high
23 — Rising volume
24 — Falling volume
25 — Volume above average (Volume > SMA(Volume, 20))
26 — Volume below average (Volume < SMA(Volume, 20))
27 — High body to range ratio (Abs(Close - Open) / (High - Low) > 0.5)
28 — Low body to range ratio (Abs(Close - Open) / (High - Low) < 0.5)
29 — High relative volatility (ATR(7) > ATR(40))
30 — Low relative volatility (ATR(7) < ATR(40))
31 — External condition 1
32 — External condition 2
33 — External condition 3
34 — External condition 4
35 — External condition 5
These constituent conditions fall into three distinct categories:
• Directional pairs : The numbers 1-22 correspond to pairs of opposing upward and downward conditions. For example, if one of the inputs includes "1" in the comma-separated list, that group uses the "RSI above/below threshold" condition pair. In this case, the RSI must be above a high threshold for the group to trigger an upward alert, and the RSI must be below a defined low threshold to trigger a downward alert.
• Non-directional filters : The numbers 23-30 correspond to conditions that do not represent directional information. These conditions act as filters for both upward and downward alerts. Traders often use non-directional conditions to refine trending or mean reversion signals. For instance, if one of the input lists includes "30", that group uses the "Low relative volatility" condition. The group can trigger an upward or downward alert only if the 7-period Average True Range (ATR) is below the 40-period ATR.
• External conditions : The numbers 31-35 correspond to external conditions based on the plots from other indicators on the chart. To set these conditions, use the source inputs in the "External conditions" section near the bottom of the "Settings/Inputs" tab. The external value can represent an upward, downward, or non-directional condition based on the following logic:
▫ Any value above 0 represents an upward condition.
▫ Any value below 0 represents a downward condition.
▫ If the checkbox next to the source input is selected, the condition becomes non-directional . Any group that uses the condition can trigger upward or downward alerts only if the source value is not 0.
To learn more about using plotted values from other indicators, see this article in our Help Center and the Source input section of our Pine Script™ User Manual.
Group markers
Each comma-separated list represents a distinct group , where all the listed conditions must occur to trigger an alert. This script assigns preset markers (names) to each condition group to make the active ensembles easily identifiable in the generated alert messages and labels. The markers assigned to each group use the format "M", where "M" is short for "Marker" and "x" is the group number. The titles of the inputs at the top of the "Settings/Inputs" tab show these markers for convenience.
For upward conditions, the labels and alert messages show group markers with upward triangles (e.g., "M1▲"). For downward conditions, they show markers with downward triangles (e.g., "M1▼").
NOTE: By default, this script populates the "M1" field with a pre-configured list for a mean reversion group ("2,18,24,28"). The other fields are empty. If any "M*" input does not contain a value, the indicator ignores it in the alert calculations.
Custom alert messages
By default, the indicator's alert message text contains the activated markers and their direction as a comma-separated list. Users can override this message for upward or downward alerts with the two text fields at the bottom of the "Settings/Inputs" tab. When the fields are not empty , the alerts use that text instead of the default marker list.
NOTE: This script generates alert triggers, not the alerts themselves. To set up an alert based on this script's conditions, open the "Create Alert" dialog box, then select the "Ensemble Alerts" and "Any alert() function call" options in the "Condition" tabs. See the Alerts FAQ in our Pine Script™ User Manual for more information.
Condition visualization
This script offers organized visualizations of its conditions, allowing users to inspect the behaviors of each condition alongside the specified groups. The key visual features include:
1) Conditional plots
• The indicator plots the history of each individual condition, excluding the external conditions, as circles at different levels. Opposite conditions appear at positive and negative levels with the same absolute value. The plots for each condition show values only on the bars where they occur.
• Each condition's plot is color-coded based on its type. Aqua and orange plots represent opposing directional conditions, and purple plots represent non-directional conditions. The titles of the plots also contain the condition numbers to which they apply.
• The plots in the separate pane can be turned on or off with the "Show plots in pane" checkbox near the top of the "Settings/Inputs" tab. This input only toggles the color-coded circles, which reduces the graphical load. If you deactivate these visuals, you can still inspect each condition from the script's status line and the Data Window.
• As a bonus, the indicator includes "Up alert" and "Down alert" plots in the Data Window, representing the combined upward and downward ensemble alert conditions. These plots are also usable in additional indicator-on-indicator calculations.
2) Dynamic labels
• The indicator draws a label on the main chart pane displaying the activated group markers (e.g., "M1▲") each time an alert condition occurs.
• The labels for upward alerts appear below chart bars. The labels for downward alerts appear above the bars.
NOTE: This indicator can display up to 500 labels because that is the maximum allowed for a single Pine script.
3) Background highlighting
• The indicator can highlight the main chart's background on bars where upward or downward condition groups activate. Use the "Highlight background" inputs in the "Settings/Inputs" tab to enable these highlights and customize their colors.
• Unlike the dynamic labels, these background highlights are available for all chart bars, irrespective of the number of condition occurrences.
█ NOTES
• This script uses Pine Script™ v6, the latest version of TradingView's programming language. See the Release notes and Migration guide to learn what's new in v6 and how to convert your scripts to this version.
• This script imports our new Alerts library, which features functions that provide high-level simplicity for working with complex compound conditions and alerts. We used the library's `compoundAlertMessage()` function in this indicator. It evaluates items from "bool" arrays in groups specified by an array of strings containing comma-separated index lists , returning a tuple of "string" values containing the marker of each activated group.
• The script imports the latest version of the ta library to calculate several technical indicators not included in the built-in `ta.*` namespace, including Double Exponential Moving Average (DEMA), Triple Exponential Moving Average (TEMA), Fractal Adaptive Moving Average (FRAMA), Tilson T3, Awesome Oscillator (AO), Full Stochastic (%K and %D), SuperTrend, and Donchian Channels.
• The script uses the `force_overlay` parameter in the label.new() and bgcolor() calls to display the drawings and background colors in the main chart pane.
• The plots and hlines use the available `display.*` constants to determine whether the visuals appear in the separate pane.
Look first. Then leap.
Testing

Strategy Builder [Cometreon]Strategy Builder is a powerful tool that lets you create fully customized trading strategies directly within TradingView. With support for up to 5 entry conditions and 2 exit conditions, it gives you exceptional flexibility to build and refine your own trading logic—no coding required.
It’s the ideal choice for traders who want complete control over their signal structure and decision flow.
🔷 Key Features
🟩 Multi-Condition Strategy Creation
Design strategies using up to five entry conditions and two exit conditions to tailor behavior in any market scenario.
🟩 Total Indicator Freedom
Use any indicator on TradingView—including private and custom ones—to build your strategy inputs and triggers.
🟩 Smart Condition Management
Utilize advanced logic like previous-candle signals, confirmation filters, and multi-bar requirements to make your strategy more reactive and reliable.
🔷 Technical Details and Customizable Inputs
1️⃣ Activate Signal - Option to activate or deactivate the Long or Short condition.
2️⃣ Special Condition - Activate one of several advanced logic types:
Precedent Signal : Check the condition on a previous candle (e.g., 4 candles ago).
Check Signal : See if the condition occurred within a certain range (e.g., any of the last 6 candles).
[* ]Multiple Signal : Requires the condition to occur in several consecutive candles (e.g., 3 in a row).
Confirm Signal : Confirms that the condition has not occurred in a given range.
3️⃣ Source Long and Short - Choose the first value to compare, selecting any TradingView indicator—including Cometreon’s custom tools.
4️⃣ Type Long and Short - Define how the condition is calculated, with options like:
Cross Over Value
Cross Under Value
Greater Than
Lower Than
Equal To
Increase (vs previous candle)
Decrease
No Change
Change Value
5️⃣ Only First - Prevents repeated signals by ignoring the condition if it was already active in the previous candle.
6️⃣ Type Value - Sets the comparison value type:
Normal : Manually enter a fixed value (e.g., 20 or 50)
Choose : Select another indicator as the comparison value
🔍 How to Use Strategy Builder
⚙️ Define Conditions
Set your long and short entries using your favorite indicators and logic combinations.
📊 Configure Signal
Manage how and when signals are triggered using the advanced condition options provided.
🧪 Combine with Strategy Tester
Once configured, test your strategy directly on the chart or in real backtest mode with Strategy Tester.
☄️ Unlock the potential of your trading strategies with TradeLab Beta's Strategy Builder start creating customized strategies optimized for your trading goals.
Don't waste any more time and visit the link to get access to all Cometreon indicators.

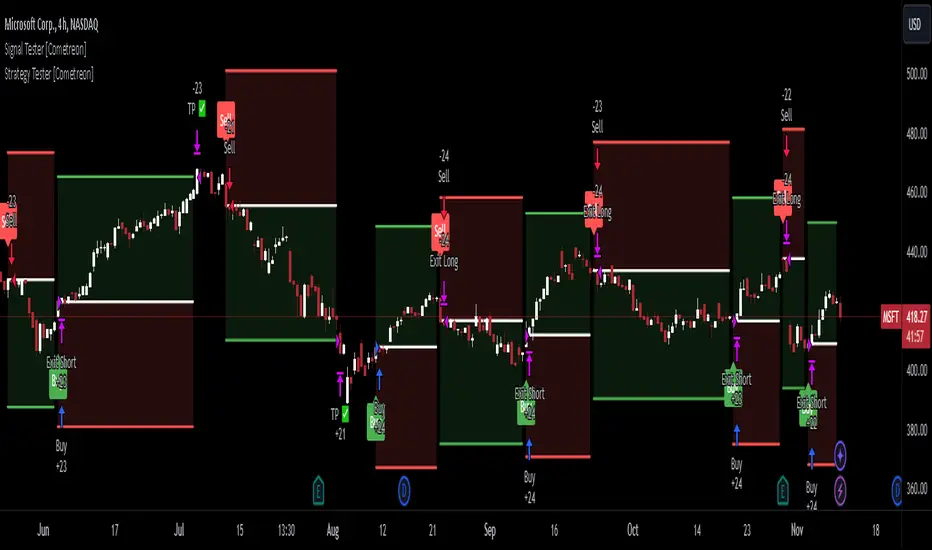
Signal Tester [Cometreon]Signal Tester is a fast and intuitive tool designed to help you visualize and analyze up to 100 past trading signals directly on the TradingView chart. Whether your signals come from bots, communities, or your own strategies, this indicator is perfect for quick validation and real-time feedback.
🔷 Key Features
🟩 Visual Signal Mapping
Display long and short entries directly on your chart for clear, immediate analysis of signal behavior.
🟩 Multi-Timeframe Compatibility
Analyze how signals behave across different timeframes to identify strengths, weaknesses, and timing.
🟩 Universal Signal Input
Test signals coming from trading bots, private groups, external alerts, or manually built strategies.
🔷 Technical Details and Customizable Inputs
1️⃣ Position Selection - Choose up to 100 recent positions—both long and short—and plot them directly on your chart.
2️⃣ Data Entry - Easily define the date and type (Long or Short) for each position directly from the settings panel.
🔍 How to Use Signal Tester Pro
📥 Input Your Signals
Add your entries and exits manually in the indicator settings.
📊 Analyze on the Chart
Visualize each trade's placement in real historical context to evaluate timing and performance.
🔁 Connect with Strategy Tester
Use the generated signals as input for Strategy Tester Pro to backtest your trading logic with full control.
☄️ Start testing your trading signals now with TradeLab Beta's Signal Tester access this powerful tool and take your market analysis to the next level!
Don't waste any more time and visit the link to get access to all Cometreon indicators.
Pivots Benchmark For Indicators (MA / OSC) This measures the pivot of your source. the peaks and valleys. and, shows ou some neat statistics if you were to use those as your entry/exit points. I consider it a purist MA designers Acid Test. if you can get good numbers on this, (remember to deduct fees), you probably should feel confident in your indicator's quality. it isn't very forgiving.
170 themes Dark/Light
your choice of highlight colour for Best/Worst achievement values.
compare to open/close average, or a 3 length EMA on close.
display solo bench of your source.
help popup for indicator values, (hideable)
show/hide individual pivot distances, which source to measure as pivot
time to measure historical setting
number of pivots to keep in buffer
it does back test and runs live!
Closed Source for now, as it is a demo version i've made with partial capabilities.
it's part of a set of performance benchmarks i hope to have finished soon.
when i release the major components i've been building up to for 2 years,
this and everything else will be open sourced.

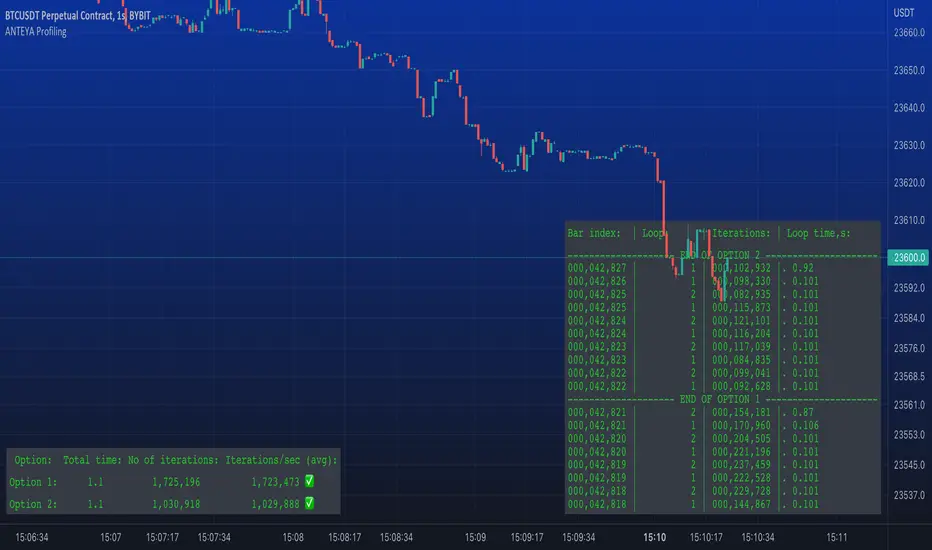
ANTEYA ProfilingThis script allows to compare which code is more efficient by running it inside a loop for a certain time or a certain number of iterations.
Just paste your pieces of code as Option 1 and Option 2 inside the loop (see comments in the script).
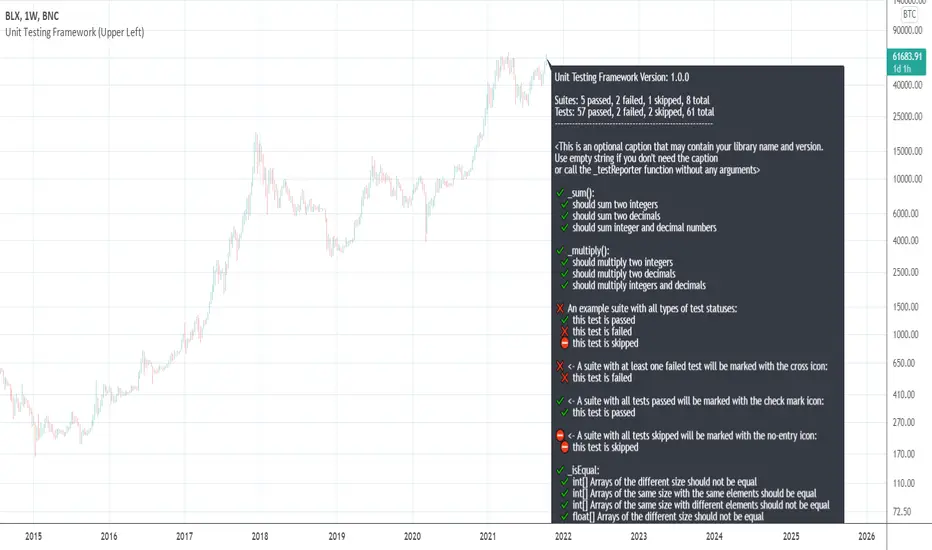
[UTILS] Unit Testing FrameworkTL;DR
This script doesn't provide any buy/sell signals.
This script won't make you profitable implicitly.
This script is intended for utility function testing, library testing, custom assertions.
It is free and open-source.
Introduction
About the idea: is not exclusive, programmers tend to use this method a lot and for a long time.
The point is to ensure that parts of a software, "units" (i.e modules, functions, procedures, class methods etc), work as they should, meet they design and behave as intended. That's why we use the term "Unit testing".
In PineScript we don't have a lot of entities mentioned above yet. What we have are functions. For example, a function that sums numbers should return a number, a particular sum. Or a professor wrote a function that calculates something or whatever. He and you want to be sure that the function works as expected and further code changes (refactoring) won't break its behaviour. What the professor needs to do is to write unit tests for his function/library of functions. And what you need to do is to check if the professor wrote tests or not.
No tests = No code
- Total test-driven development
Ok, it is not so serious, but very important in software development. And I created a tool for that.
I tried to follow the APIs of testing tools/libs/frameworks I worked or work with: Jasmine (Javascript), Mocha/Chai (Javascript), Jest (Javascript), RSpec (Ruby), unittest (Python), pytest (Python) and others. Got something workable but it would be much easier to implement (and it would look much better) if PineScript had a higher-order functions feature.
API
_describe(suiteName: string)
A function to declare a test suite. Each suite with tests may have 2 statuses:
✔️ Passed
❌ Failed
A suite is considered to be failed if at least one of the specs in it has failed.
_it(specName: string, actual: any, expected: any)
A function to run a test. Each test may have 3 statuses:
✔️ Passed
❌ Failed
⛔ Skipped
Some examples:
_it("is a falsey value", 1 != 2, true)
_it("is not a number", na(something), true)
_it("should sum two integers", _sum(1, 2), 1)
_it("arrays are equal", _isEqual(array.from(1, 2), array.from(1, 2)), true)
Remember that both the 'actual' and 'expected' arguments must be of the same type.
And a group of _it() functions must be preceded by a _describe() declaration (see in the code).
_test(specName: string, actual: any, expected: any)
An alias for _it . Does the same thing.
_xit(specName: string, actual: any, expected: any)
A function to skip a particular test for a while. Doesn't make any comparisons, but the test will appear in the results as skipped.
This feature is unstable and may be removed in the future releases.
_xtest(specName: string, actual: any, expected: any)
An alias for _xit . Does the same thing.
_isEqual(id_1: array, id_2: array)
A function to compare two arrays for equality. Both arrays must be of the same type.
This function doesn't take into account the order of elements in each array. So arrays like (1, 2, 3) and (3, 2, 1) will be equal.
_isStrictEqual(id_1: array, id_2: array)
A function to compare two arrays for equality. Both arrays must be of the same type.
This function is a stricter version of _isEqual because it takes into account the order of elements in each array. So arrays like (1, 2, 3) and (3, 2, 1) won't be equal.
Usage
To use this script to test your library you need to do the following steps:
1) Copy all the code you see between line #5 and #282 (Unit Testing Framework Core)
2) Place the copied code at the very beginning of your script (but below study())
3) Start to write suites and tests where your code ends. That's it.
NOTE
The current version is 0.0.1 which means that a lot of things may be changed on the way to 1.0.0 - the first stable version.
Cosmic BB SRThis script is based on Bollinger Bands/Bandwidth data and displays support and resistance levels (thick horizontal lines), the direction/volatility of the levels (thin dynamic lines), and the testing of the levels (cross markers).

Formula for Day Trading NSEINDAtesting script. please try at your own risk. don't claim if any damage

Manual Back Test LinesI created this indicator to primarily manually test other indicators in replay mode.
To use this indicator generally you will:
Select trade type: long or short
Enter your ATR (enter the actual ATR). The indicator will then calculate and plot your SL and targets based on your values
Default Stop Loss is ATR * 1.5
Default Target 1 is ATR * 1.5
Default Target 2 is ATR * 3
Using this indicator on Replay mode is great. What you do is go back in time. Hit play and as the indicator(s) you use provide signals pause.
Pull up options:
Select trade type
Update ATR value
Change date to entry date. Typically if you are trading off the daily timeframe you are going to wait for your current day candle to close to provide signal. That would mean your entry would be on the next day.
Click play and watch, track and record how trade unfolds.
Future updates:
I'd like to be able to have some way to click one button and have it fire that enter trade right now on chart. Also I'm working on figuring out how to calculate the ATR on the entry date so that isn't required to be entered.
Finally, I'd like to have some auto calculation on when targets and SL are hit. I have this partially done but it's more important that I use this indicator than spend time or funds to update it to do that. But I do plan on updating.

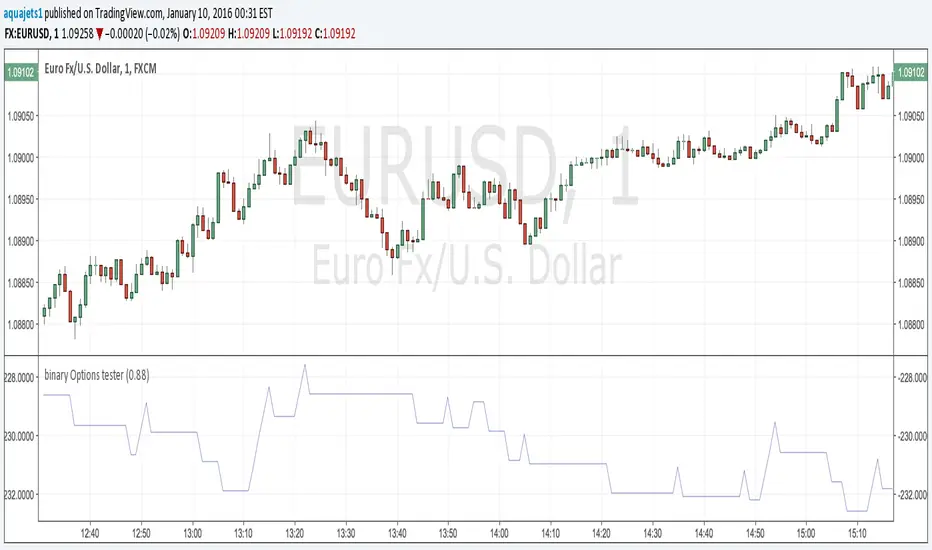
Binary Options Strategy Testing ScriptThis is a script for testing binary options trading strategies. To test a strategy, modify the 'go_down' or 'go_up' booleans. These SHOULD NOT access any current values (for example, 'ohlc4' or 'close '), or the backtesting will not be an accurate representation of the forward values.
Modify the fraction_return input to be the return rate of the option on success. This is assumed to be a true 100 or 0 option- i.e. if the choice is not correct, there is a 100% loss.
The strategy in place is merely an example, and as you can see, has a very negative rate of return when implemented as a strategy.
Please comment in your code if you use this in any future posts. Thanks!