SMC Sessions NYThis script plots vertical session markers on the chart to highlight session opens and closes based on New York time.
Key characteristics:
The indicator is plotted on the price chart (overlay).
It draws thin, dotted vertical lines at specific session times.
Sessions are calculated using the America/New_York timezone to ensure correct alignment.
Only weekdays (Monday to Friday) are considered.
The script draws sessions for today and up to one week back (maximum 7 calendar days).
All drawings are created once on the last bar to avoid duplicates and performance issues.
Each session has its own color for clear visual distinction:
Asia session (open)
London session (open and close)
New York / Kill Zone Morning (open and close)
Lunch session (open and close)
New York / Kill Zone Afternoon (open and close)
The Asia session open at 20:00 NY is intentionally excluded on Fridays, as there is no valid Asia session start on Friday evening.
The vertical lines extend across the entire visible price range of the chart.
The script is optimized to stay well within TradingView object limits.
Purpose:
The indicator is designed to give traders a clean, non-intrusive visual reference for key session transitions, helping to analyze price behavior around session opens and closes without cluttering the chart.
This approach is suitable for intraday and session-based trading models, including SMC-style workflows.
Timebased

Sessions Pro+ (@JP7FX)Sessions Pro Plus (JP7FX)
Sessions Pro Plus marks key trading sessions and gives real time session information. It helps traders track session behaviour without manual work.
Session Info Panel
Shows live updates for Tokyo, Frankfurt, London and New York.
Displays if session highs or lows are intact or taken.
Includes a countdown to the next session start.
Range High and Low Alerts
Alerts trigger when a session high or low is breached.
Useful for monitoring breaks, sweeps and changes in behaviour.
Daily Open Bias
Shows whether price is above or below the daily open.
Helps traders understand directional conditions quickly.
Custom Session Settings
Session times can be adjusted to fit personal trading hours.
Sessions can be renamed and recoloured for clarity.
Webhook and Real Time Alerts
Alerts support webhook integrations for external platforms, including Discord.
Countdown Timers
Displays countdowns to the next session open to help plan ahead.
This indicator is designed for traders who follow session timing, session highs and lows, and daily open behaviour. It aims to simplify chart preparation and reduce the need to track session information manually.

Volume Surprise [LuxAlgo]The Volume Surprise tool displays the trading volume alongside the expected volume at that time, allowing users to spot unexpected trading activity on the chart easily.
The tool includes an extrapolation of the estimated volume for future periods, allowing forecasting future trading activity.
🔶 USAGE
We define Volume Surprise as a situation where the actual trading volume deviates significantly from its expected value at a given time.
Being able to determine if trading activity is higher or lower than expected allows us to precisely gauge the interest of market participants in specific trends.
A histogram constructed from the difference between the volume and expected volume is provided to easily highlight the difference between the two and may be used as a standalone.
The tool can also help quantify the impact of specific market events, such as news about an instrument. For example, an important announcement leading to volume below expectations might be a sign of market participants underestimating the impact of the announcement.
Like in the example above, it is possible to observe cases where the volume significantly differs from the expected one, which might be interpreted as an anomaly leading to a correction.
🔹 Detecting Rare Trading Activity
Expected volume is defined as the mean (or median if we want to limit the impact of outliers) of the volume grouped at a specific point in time. This value depends on grouping volume based on periods, which can be user-defined.
However, it is possible to adjust the indicator to overestimate/underestimate expected volume, allowing for highlighting excessively high or low volume at specific times.
In order to do this, select "Percentiles" as the summary method, and change the percentiles value to a value that is close to 100 (overestimate expected volume) or to 0 (underestimate expected volume).
In the example above, we are only interested in detecting volume that is excessively high, we use the 95th percentile to do so, effectively highlighting when volume is higher than 95% of the volumes recorded at that time.
🔶 DETAILS
🔹 Choosing the Right Periods
Our expected volume value depends on grouping volume based on periods, which can be user-defined.
For example, if only the hourly period is selected, volumes are grouped by their respective hours. As such, to get the expected volume for the hour 7 PM, we collect and group the historical volumes that occurred at 7 PM and average them to get our expected value at that time.
Users are not limited to selecting a single period, and can group volume using a combination of all the available periods.
Do note that when on lower timeframes, only having higher periods will lead to less precise expected values. Enabling periods that are too low might prevent grouping. Finally, enabling a lot of periods will, on the other hand, lead to a lot of groups, preventing the ability to get effective expected values.
In order to avoid changing periods by navigating across multiple timeframes, an "Auto Selection" setting is provided.
🔹 Group Length
The length setting allows controlling the maximum size of a volume group. Using higher lengths will provide an expected value on more historical data, further highlighting recurring patterns.
🔹 Recommended Assets
Obtaining the expected volume for a specific period (time of the day, day of the week, quarter, etc) is most effective when on assets showing higher signs of periodicity in their trading activity.
This is visible on stocks, futures, and forex pairs, which tend to have a defined, recognizable interval with usually higher trading activity.
Assets such as cryptocurrencies will usually not have a clearly defined periodic trading activity, which lowers the validity of forecasts produced by the tool, as well as any conclusions originating from the volume to expected volume comparisons.
🔶 SETTINGS
Length: Maximum number of records in a volume group for a specific period. Older values are discarded.
Smooth: Period of a SMA used to smooth volume. The smoothing affects the expected value.
🔹 Periods
Auto Selection: Automatically choose a practical combination of periods based on the chart timeframe.
Custom periods can be used if disabling "Auto Selection". Available periods include:
- Minutes
- Hours
- Days (can be: Day of Week, Day of Month, Day of Year)
- Months
- Quarters
🔹 Summary
Method: Method used to obtain the expected value. Options include Mean (default) or Percentile.
Percentile: Percentile number used if "Method" is set to "Percentile". A value of 50 will effectively use a median for the expected value.
🔹 Forecast
Forecast Window: Number of bars ahead for which the expected volume is predicted.
Style: Style settings of the forecast.

Uptrick: Time Based ReversionIntroduction
The Uptrick: Time Based Reversion indicator is designed to provide a comprehensive view of market momentum and potential trend shifts by combining multiple moving averages, a streak-based trend analysis system, and adaptive color visualization. It helps traders identify strong trends, spot potential reversals, and make more informed trading decisions.
Purpose
The primary goal of this indicator is to assist traders in distinguishing between sustained market movements and short-lived fluctuations. By evaluating how price behaves relative to its moving averages, and by measuring consecutive streaks above or below these averages, the indicator highlights areas where trends are likely to continue or lose momentum.
Overview
Uptrick: Time Based Reversion calculates one or more moving averages of price data and then tracks the number of consecutive bars (streaks) above or below these averages. This streak-based detection provides insight into whether a trend is gaining strength or nearing a potential reversal point. The indicator offers:
• Multiple moving average types (SMA, EMA, WMA)
• Optional second and third moving average layers for additional smoothing of first moving average
• A streak detection system to quantify trend intensity
• A dynamic color scheme that changes with streak strength
• Optional buy and sell signals for potential trade entries and exits
• A ribbon mode that applies moving averages to Open, High, Low, and Close prices for a more detailed visualization of overall trend alignment
Originality and Uniqueness
Unlike traditional moving average indicators, Uptrick: Time Based Reversion incorporates a streak measurement system to detect trend strength. This approach helps clarify whether a price movement is merely a quick fluctuation or part of a longer-lasting trend. Additionally, the optional ribbon mode extends this logic to Open, High, Low, and Close prices, creating a layered and intuitive visualization that shows complete trend alignment.
Inputs and Features
1. Enable Ribbon Mode
This input lets you activate or deactivate the ribbon display of multiple moving averages. When enabled, the script plots moving averages for the Open, High, Low, and Close prices and uses color fills to show whether these four data points are collectively above or below their respective moving averages.
2. Color Scheme Selection
Users can choose from several predefined color schemes, such as Default, Emerald, Crimson, Sapphire, Gold, Purple, Teal, Orange, Gray, Lime, or Aqua. Each scheme assigns distinct bullish, bearish and neutral colors..
3. Show Buy/Sell Signals
The indicator can display buy or sell signals based on its streak analysis logic. These signals appear as markers on the chart, indicating a “Safe Uptrend” (buy) or “Safe Downtrend” (sell).
4. Moving Average Types and Lengths
• First MA Type and Length: Choose SMA, EMA, or WMA along with a customizable period.
• Second and Third MA Types and Lengths: You can optionally stack additional moving averages for further smoothing, each with its own customizable type and period.
5. Streak Threshold Multiplier
This numeric input determines how strong a streak must be before the script considers it a “safe” trend. A higher multiplier requires a longer or more intense streak for a buy or sell signal.
6. Dynamic Transparency Calculation
The color intensity adapts to the streak’s strength. Longer streaks increase the transparency of the opposing color, making the current dominant color stand out. This feature ensures that a vigorous uptrend or downtrend is visually distinct from short-lived or weaker moves.
7. Ribbon Moving Averages
In ribbon mode, the script calculates moving averages for the Open, High, Low, and Close prices. Each of these is optionally smoothed again if the second and/or third moving average layers are active. The final result is a ribbon of moving averages that helps confirm whether the market is uniformly aligned above or below these key reference points.
Calculation Methodology
1. Initial Moving Average
The script calculates the first moving average (SMA, EMA, or WMA) of the closing price over a user-defined period.
2. Optional Secondary and Tertiary Averages
If selected, the script then applies a second and/or third smoothing step. Each of these steps can be a different type of moving average (SMA, EMA, or WMA) with its own period length.
3. Streak Detection
The indicator counts consecutive bars above or below the smoothed moving average. A running total (streakUp or streakDown) increments with every bar that remains above or below that average.
4. Reversion Intensity
The script compares the current streak value to its own average (calculated over the final chosen period). This ratio determines whether the streak is nearing a likely reversion or is strong enough to continue.
5. Color Assignment and Signals
The indicator calculates color transparency based on streak intensity. Buy and sell signals appear when the streak meets or exceeds the threshold multiplier, indicating a safe uptrend or downtrend.
Color Schemes and Visualization
This indicator offers multiple predefined color sets. Each scheme specifies a unique bullish color, bearish color and neutral color. The script automatically varies transparency to highlight strong trends and fade weaker ones, making it visually clear when a trend is intensifying or losing momentum.
Smoothing Techniques
By allowing up to three layers of moving average smoothing, the indicator accommodates different trading styles. A single layer provides faster reactions to market changes, while more layers reduce noise at the cost of slower responsiveness. Traders can choose the right balance between responsiveness and stability for their strategy, whether it is short-term scalping or long-term trend following.
Why It Combines Specific Smoothing Techniques
The Uptrick: Time Based Reversion indicator strategically combines specific smoothing techniques—SMA, EMA, and WMA—to leverage their complementary strengths. The SMA provides stable and consistent trend identification by equally weighting all data points, while the EMA emphasizes recent price movements, allowing quicker responses to market changes. WMA enhances sensitivity to recent price shifts, which helps in detecting subtle momentum changes early. By integrating these methods in layers, the indicator effectively balances responsiveness with stability, helping traders clearly identify genuine trend changes while filtering out short-term noise and false signals.
Ribbon Mode
If Open, High, Low, and Close prices remain above or below their respective moving averages consistently, the script colors the bars fully bullish or bearish. When the data points are mixed, a neutral color is applied. This mode provides a thorough perspective on whether the entire price range is aligned in one direction or showing conflicting signals.
Summary
Uptrick: Time Based Reversion combines multiple moving averages, streak detection, and dynamic color adjustments to help traders identify significant trends and potential reversal areas. Its flexibility allows it to be used either in a simpler form, with one moving average and streak analysis, or in a more advanced configuration with ribbon mode that charts multiple smoothed averages for a deeper understanding of price alignment. By adapting color intensities based on streak strength and providing optional buy/sell signals, this indicator delivers a clear and flexible tool suited to various trading strategies.
Disclaimer
This indicator is designed as an analysis aid and does not guarantee profitable trades. Past performance does not indicate future success, and market conditions can change unexpectedly. Users are advised to employ proper risk management and thoroughly evaluate trades before taking positions. Use this indicator as part of a broader strategy, not as a sole decision-making tool.

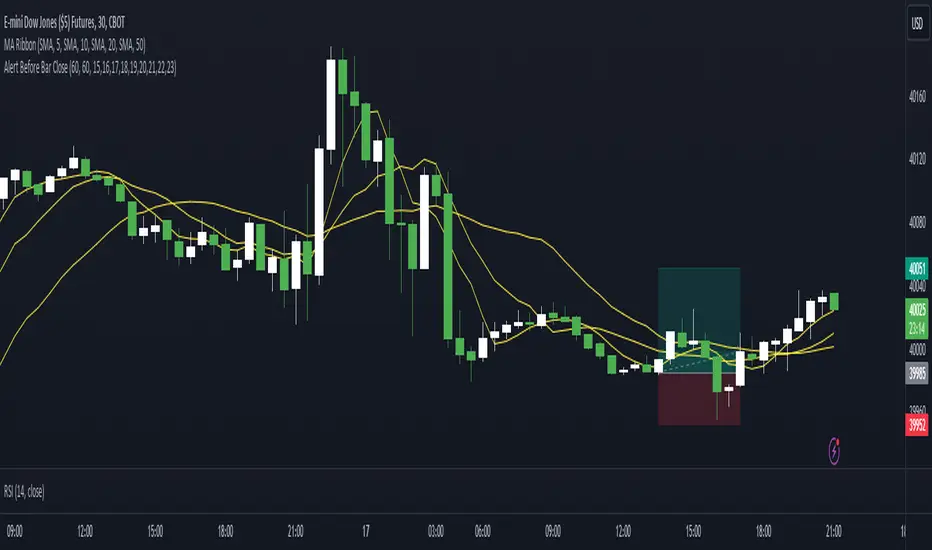
Alert Before Bar Closei.imgur.com
Alert Before Bar Close
==========================
Example Figure
Originality and usefulness
This indicator/alert mechanism is unique in two ways. First, it provides alerts before the close of a candlestick, allowing time-based traders to prepare early to determine if the market is about to form a setup. Second, it introduces an observation time mechanism, enabling time-based traders to observe when the market is active, thereby avoiding too many false signals during electronic trading or when trading is light.
Detail
Regarding the settings (Arrow 1). The first input is to select the candlestick period you want to observe. The second is to notify a few seconds in advance. The third input sets the observation time. For example, if you set "1,2,3,4,5," the alert mechanism will only be activated during the period from 01:00:00 to 05:59:59, consistent with the time zone you set in TradingView. Additionally, I have set it so that the alert will only trigger once per candlestick, so don't worry about repeated alerts.
The alert setup is very simple, too. Follow the steps (Arrow 2, 3) to complete the setup. I have tested several periods and successfully received alerts on both mobile and computer. If anyone encounters any issues, feel free to let me know.
Time Based Comparison Tool [TFO]The goal of this indicator is to show how multiple assets are trading relative to their Previous Highs and Lows. Many traders have probably seen charts resembling this that may plot how asset prices are trading as a percent change over time, or something similar.
The key difference with this indicator is that all prices are normalized to reflect how they are trading with respect to the previous range of a user-defined timeframe. Without the normalization process, we would simply be observing some percent change from a given point in time; but this does not provide enough information to describe where price is trading relative to our desired frame of reference.
For example, if the timeframe setting was chosen to be 1 day, the indicator would plot the Previous High (PH) and Previous Low (PL) of the current symbol on the daily timeframe, denoted here by the black lines and labels. Then, the adjusted price of all selected symbols would be shown to visualize how each one is moving with respect its own PH and PL, using the current symbol's PH and PL as reference points.
In the above chart, we can see that CL was trading below its PDL from about 10:00-11:00 am EST, then broke above and retested it at around 11:20 am EST, before trading higher. To verify that this comparison works as intended, we can check to see that CL did in fact retest its PDL at this time before trading higher. Note that we are using the close price for this evaluation.
Since limiting the output to close prices can leave out some vital information, we can change the Plot Type setting from "Close" to "High to Low," which will instead show the range of prices from high to low instead of just the close.
We can expand on this by detecting when PH's and PL's have been raided (traded through), by displaying the text PHR (Previous High Raid) or PLR (Previous Low Raid) next to the symbol's label on the right. In this case below, where we're using the 1 week timeframe, we can observe that NQ1! (purple) traded through the PL level and thus its label (right) is updated to indicate a PLR.
Similarly, YM1! traded through its PH level and was updated to indicate a PHR; and ES1! raided both levels, with its label reflecting just that.
Due to the native limitation of output series in a single pine script, alerts have been consolidated to "Any PHR" or "Any PLR," meaning these alerts would fire if any of the selected symbols raided a PH or PL, respectively. If one wanted to be alerted for just a specific symbol, this could be achieved by deselecting all symbols except that which is desired, then setting an alert and adjusting its title for easier user recognition.

itradesize /\ Model x RTH Gap
I’m happy to announce my model and sharing it with you as an indicator.
About the model
The model is based on a range from 18:00 until 1:30. If you are keen you probably know that it's something that based on a bit of Daye's Theory. As Daily Q4 is from 18:00 until 0:00 and I've added a 90's Q1 to it as well that's why it ended up at 1:30.
It's an accumulation range and where we are looking for some opportunities above or below it when the algo is trying to fake the traders as the high and the low of the range are both important zones for liquidity pools. This model works on almost every pair but I've been mostly focusing on indices, especially on ES, NQ, and EUR/USD.
Do not trade before 1:30 AM and do not trade this model after 6:00 AM. So any tradable setup must be valid until 6:00 AM.
*All the mentioned times are based on America/NewYork timezone.
A simple sell setup
∆ If it takes the high of the model, then look for short opportunities.
∆ The best reliable scenario is when a high is taken while retracing back to an HTF PD Array so it will end up in a failure swing, Judas swing, you name it.
∆ When a high is taken you should wait for a market structure shift then it should give a nice displacement where it should retrace.
∆ The imbalance after the shift can be on every timeframe, based on your trade idea.
∆ If there are more imbalances, your decision on which to go with (as if there is a BPR, Breaker, OB, etc.. - can change the view of an FVG).
The same story goes for a buy setup.
∆ The first target is always the EQ of the model's range.
∆ The second target could be liquidity inside the EQ and the other side of the model (optional).
∆ The third target is the other side of the model.
∆ You can always leave a runner there if you eyeing some levels outside the model.
Additional information
∆ You can use silver bullet range as an extra confirmation when you looking for the actual displacement.
∆ An RTH range is also added to the indicator (starts drawing at 9:30 when the futures market opens) as it can be used to trade in the NY session and it is a must-have thing when trading indices.
∆ The colors of every label are switched automatically based on your chart's coloring.
