Time Range Marker By BCB ElevateThe Time Range Marker is a simple yet powerful visual tool for traders who want to focus on specific time intervals within the trading day. This indicator highlights a custom time range on your chart using a background color, helping you visually isolate key trading sessions or event windows such as:
Market open/close hours
News release periods
High-volatility trading zones
Personal strategy testing windows
⚙️ Key Features:
Customizable start and end time (hour & minute)
Works across all intraday timeframes
Adjustable highlight color to match your chart theme
Built using Pine Script v5 for speed and flexibility
🔧 Settings:
Start Hour / Minute – Set the beginning of the time range (in 24-hour format)
End Hour / Minute – Define when the range ends
Highlight Color – Choose the background color for better visibility
🕒 Timezone Note:
The indicator uses UTC time by default to ensure accuracy across markets. If your broker uses a different timezone (like EST, IST, etc.), the script can be adjusted to reflect your local market hours.
✅ How to Use the Time Range Marker Indicator
This indicator is used to visually highlight a specific time window each trading day, such as:
Market open or close sessions (e.g., NYSE, London, Tokyo)
High-impact news release periods
Custom time slots for strategy testing or scalping
🛠️ Installation Steps
Open TradingView and go to any chart.
Click on Pine Editor at the bottom of the screen.
Copy and paste the full Pine Script (shared above) into the editor.
Click the “Add to Chart” ▶️ button.
The indicator will appear on the chart with a highlighted background during the time range you set.
⚙️ How to Customize the Time Range
After adding the indicator:
Click the gear icon ⚙️ next to the indicator’s name on the chart.
Adjust the following settings:
Start Hour / Start Minute: The beginning of your time range (in 24-hour format).
End Hour / End Minute: When the highlight should stop.
Highlight Color: Pick a color and transparency for visual clarity.
Click OK to apply changes.
🕒 Timezone Consideration
By default, the indicator uses UTC (Coordinated Universal Time).
To match your broker’s timezone (e.g., EST, IST, etc.), you'll need to adjust the script by changing:
sessStart = timestamp("Etc/UTC", ...)
sessEnd = timestamp("Etc/UTC", ...)
to your correct timezone, like "Asia/Kolkata" for IST or "America/New_York" for EST.
Let me know your broker or local timezone, and I’ll update it for you.
📈 Tips for Traders
Combine this with volume, price action, or breakout indicators to focus your strategy on high-probability time windows.
Use multiple versions of this script if you want to highlight more than one time range in a day.
Timerange

Silver Bullet 5 minutes Box - By KaVeHThis indicator plots high-low range boxes based on selected intraday time windows on the 5-minute chart. It's inspired by the "Silver Bullet" trading concept, highlighting key liquidity grabs and volatility pockets at predefined times. It helps traders visually identify potential smart money trading windows during the New York session and other time anchors.
⚠️ This script only works on the 5-minute chart.
📦 Main Features:
⏰ Customizable Time Boxes:
Define up to 4 separate time windows per day:
3:00 AM – 3:05 AM (New York time) (Box 1)
10:00 AM – 10:05 AM (New York time) (Box 2)
2:00 PM – 2:05 PM (New York time) (Box 3)
8:00 PM – 8:05 PM (New York time) (Box 4)
🎨 Color and Visibility Control:
Each box can be independently toggled and colored for visual distinction.
🕔 New York Time Based:
All timestamps are automatically adjusted to New York Time, aligning with institutional market behavior.
📉 Post-Box Projection:
After each time window closes, a box extends forward 6 hours (72 bars on a 5-minute chart) to highlight the range.
💡 Use Case:
These boxes are best used to:
Detect liquidity sweeps.
Mark potential entry or exit zones.
Track price behavior after specific time-based events.
For example, the 10 AM box is often used to identify setups just after the NYSE open and into the first hour of volatility.
⚠️ TradingView Compliance Notes:
This script is original and does not replicate or resell premium/paid indicators.
All logic is coded from scratch by kaveh_mirmousavi, using public concepts from ICT/Smart Money Trading.
Fully complies with the Mozilla Public License 2.0.
Does not include financial advice or signals — for educational use only.
✅ How to Use:
Apply to a 5-minute chart.
Adjust the desired time boxes in the input panel.
Watch for price action within and after the boxes.
Enjoy and feel free to share feedback or ideas for improvement!

Chart Box Session Indicator [The Quant Science]This indicator allows highlighting specific time sessions within a chart by creating colored boxes to represent the price range of the selected session. Is an advanced and flexible tool for chart segmenting trading sessions. Thanks to its extensive customization options and advanced visualization features, it allows traders to gain a clear representation of key market areas based on chosen time intervals.
The indicator offers two range calculation modes:
Body to Body: considers the range between the opening and closing price.
Wick to Wick: considers the range between the session's low and high.
Body To Body
Wick to Wick
Key Features
1. Session Configuration
- Users can select the time range of the session of interest.
- Option to choose the day of the week for the calculation.
- Supports UTC timezone selection to correctly align data.
2. Customizable Visualization
- Option to display session price lines.
- Ability to show a central price line.
- Extension of session lines beyond the specified duration.
3. Design Display Configuration
- Three different background configurations to suit light and dark themes.
- Two gradient modes for session coloring:
- Centered: the color is evenly distributed.
- Off-Centered: the gradient is asymmetrical.
How It Works
The indicator determines whether the current time falls within the selected session, creating a colored box that highlights the corresponding price range. Depending on user preferences, the indicator draws horizontal lines at the minimum and maximum price levels and, optionally, a central line.
During the session:
- The lowest and highest session prices are dynamically updated.
- The range is divided into 10 bands to create a gradient effect.
- A colored box is generated to visually highlight the chosen session.
If the Extend Lines option is enabled, price lines continue even after the session ends, keeping the range visible for further analysis.
This indicator is useful for traders who want to analyze price behavior in specific timeframes. It is particularly beneficial for strategies based on market sessions (e.g., London or New York open) or for identifying accumulation and distribution zones.

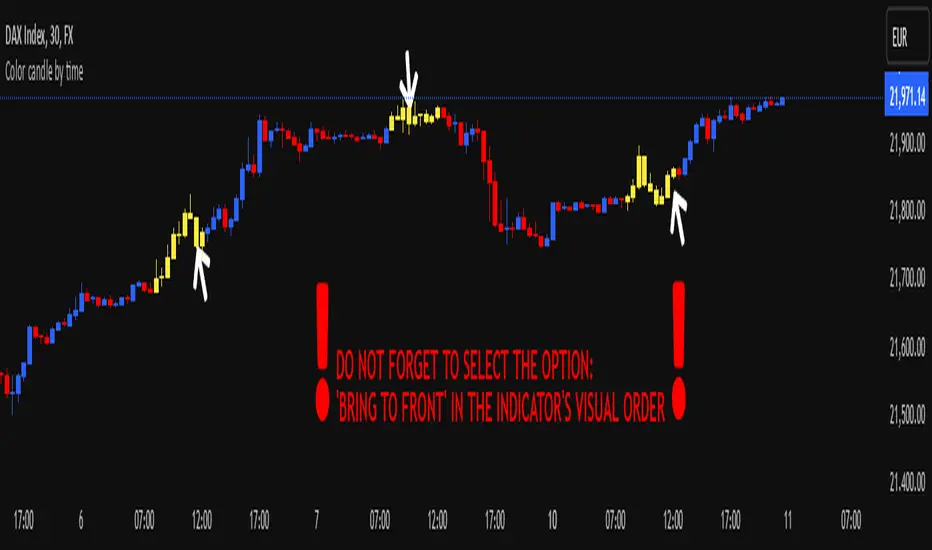
Color candle by time
This indicator, written in Pine Script v5, allows you to highlight candles (using a user-selected color) that fall within a user-defined time range. Candles outside this range maintain their original appearance.
How it Works and Key Benefits:
- Time Interval Customization: By specifying start and end hours/minutes, you can emphasize only the desired market session.
- Choice of Preferred Color: The body, wicks, and borders of the candles within the selected range are uniformly colored, based on the user’s chosen tone.
- Enhanced Focus on Price Action: By focusing on the most relevant trading hours, your analysis becomes more streamlined and intuitive, without altering the rest of the session’s candle appearance.
!! DO NOT FORGET TO SELECT THE OPTION: 'BRING TO FRONT' IN THE INDICATOR'S VISUAL ORDER !!
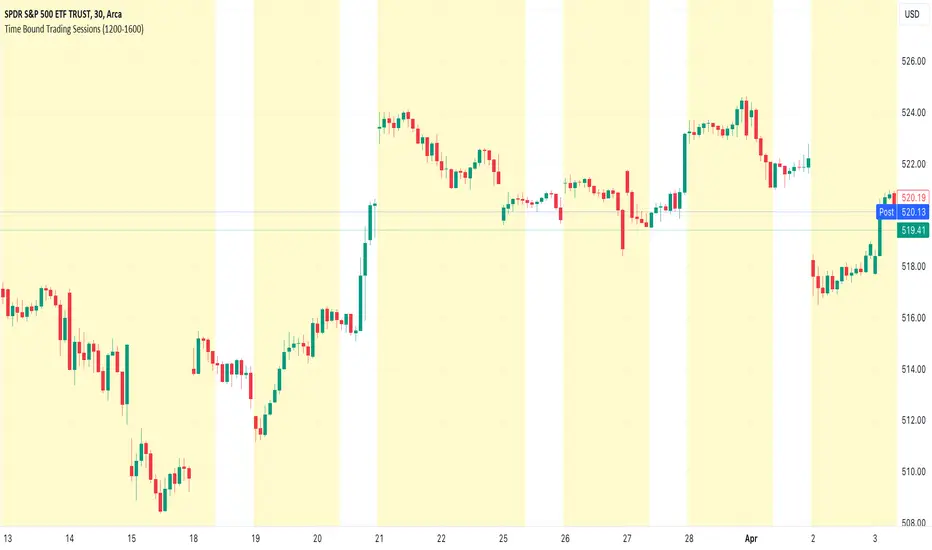
Time Bound Trading SessionsTime Bound Trading Sessions allows to add time bound conditions to your trading sessions given a date range , a time range and/or days of the week .
This indicator can be very handy if you want to control your trading sessions along those three time boundaries, applying them together and/or separately.
Feel free to reuse this code in your own strategy, and leverage the inSession condition as needed.
Features
+ It allows for date range start and/or end to be set.
+ It allows for session time range to be set.
+ It allows for days of the week to be set.
+ It applies chart background color if we are not within the given time bound session parameters.
+ It includes turn on/off functionality.
Settings
Date Range
+ {Start} checkbox: turns on/off start date
+ {Start} date/time
+ {End} checkbox: turns on/off end date
+ {End} date/time
Time Range
+ {Session} checkbox: turns on/off session time range
+ {Session} time range
Days
+ {M} checkbox: turns on/off Mondays
+ {T} checkbox: turns on/off Tuesdays
+ {W} checkbox: turns on/off Wednesdays
+ {T} checkbox: turns on/off Thursdays
+ {F} checkbox: turns on/off Fridays
+ {S} checkbox: turns on/off Saturdays
+ {S} checkbox: turns on/off Sundays
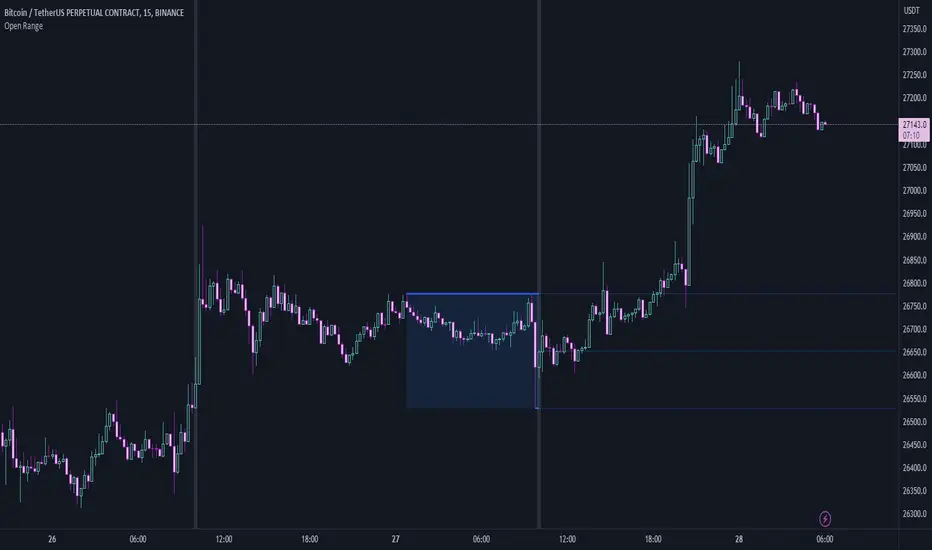
Open RangeThis is a simple script that will look back a set number of candles at a specified time (example: Ny Open) and find the "High and Low " of the range/ market in the given look back period. It will then draw two lines and the range zone as a box. Breakout traders can use these levels to help find interesting areas for a breakout. Reversal traders can use these levels to help locate false breakouts.
Simple type in your time zone Example: GMT-4
Set the time you want the indicator to draw the start line Example: 8:30am
then set the candle look back Example: 60
Hope this script helps spark some ideas
Happy trading

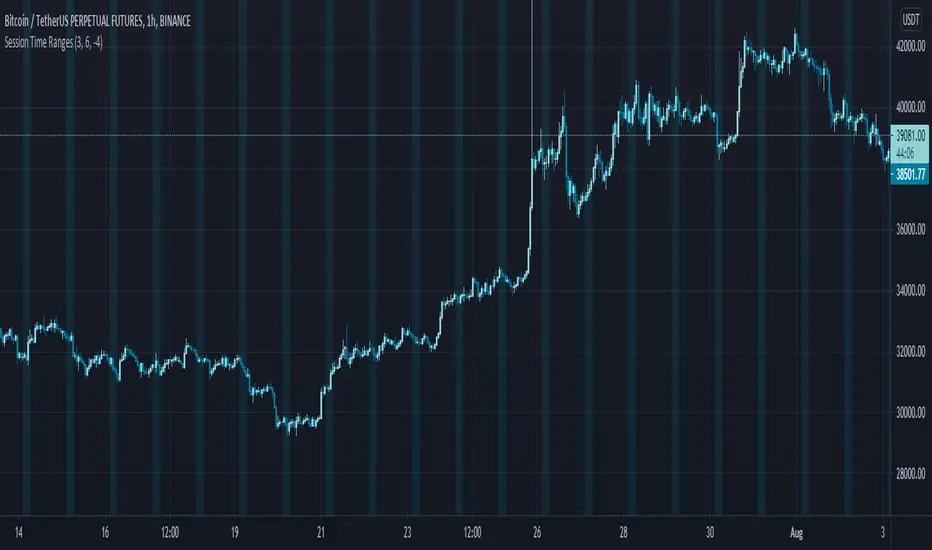
Session Time RangesHave you ever wondered if you are trading at the right time of the day or feel like all the good trades happen when you are sleeping? Well now you can check your theory :)
This Script allows you to highlight a time range on your chart over a 24hour time period. For example 3AM to 6AM
The script has two time variables, set your start time and end time based on a 24 hour clock and set the time zone offset variable to match your charts time zone. For example New York -4 (for utc just enter 0 for no offset )
This is a quick script I put together so hopefully it is error free enjoy :)