Position Sizer (% of Acct & Shares Req)
This indicator calculates % position size and share quantity required based on total capital and user-defined risk percentages
This indicator differs from the Shares Qty indicator in that it is based on %'s rather than a user-defined, fixed dollar amount to risk (for those who prefer to calculate risk in this manner instead)
Tracks real-time Low of Day (LoD) during regular trading hours (RTH) for accurate stop placement
Current price as well as output rows 2 and 3 can be toggled on/off, per preference
Allows stop loss selection between LoD, Low of Week (LoW), and Prior Day Low (PDL)
Keeps data updating intraday to reflect changing LoD and price conditions
Provides a second “Stop Loss Compare” dropdown to compare two stop methods side by side
Displays all results in a dynamic on-chart table that updates with live prices
Shows capital amount, stop type, stop price, and share counts for three risk levels
=========
Risk rows displayed as: Risk of Cap Amt: ,
=========
Disclaimer:
This indicator is for educational and informational purposes only. It should not be used as the sole basis for trading decisions. Always combine with other forms of analysis, proper risk management techniques, and consider your individual trading plan and risk tolerance. All calculations and outputs are provided as-is, and it is your responsibility to verify their accuracy before making any trading decisions.
Total

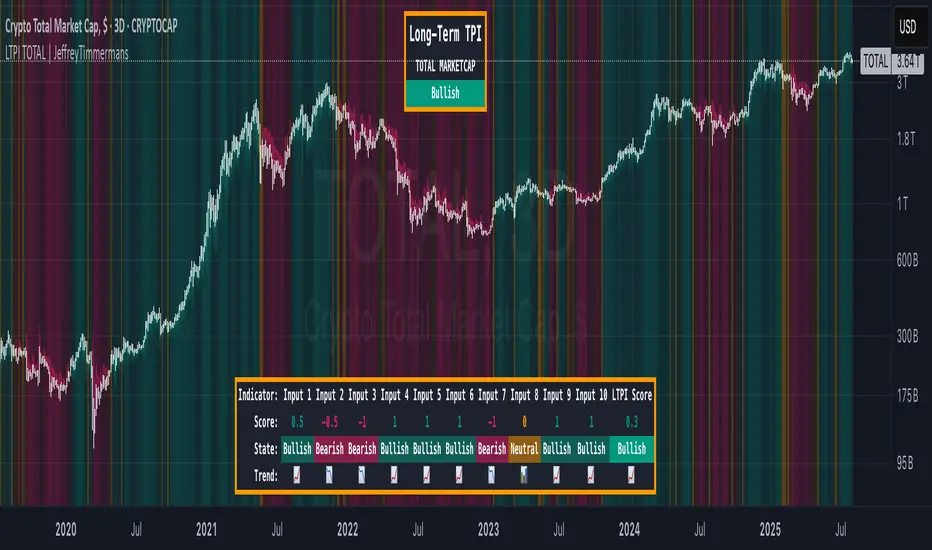
LTPI TOTAL | JeffreyTimmermansLong-Term Trend Probability Indicator
The "Long-Term Trend Probability Indicator" on TOTAL is a custom-built tool designed to analyze the global crypto market (TOTAL) from a long-term perspective. Unlike short-term indicators that react to price volatility, LTPI focuses on major trend shifts across the entire crypto market, helping to identify major trend shifts early.
This version of the LTPI is applied to the TOTAL market cap, making it a broad trend following tool.
Key Features
Long-Term Focus:
Designed for macro market analysis with less sensitivity to short-term noise.
10 Input Signals:
Combines 10 carefully selected inputs (trend following indicators) into a single score that reflects the overall market condition.
Market Regimes:
Classifies the TOTAL market into:
Bullish: Strong uptrend, expansion phase
Bearish: Strong downtrend, contraction phase
Neutral: Transitional or uncertain
Visual Background:
Background colors clearly display which regime is active.
Comprehensive Dashboard:
The panel at the bottom shows each input’s state, the composite LTPI score, and the resulting market trend.
How It Works
Inputs Analysis:
Each of the 10 inputs outputs one of three states:
+1 (Bullish)
-1 (Bearish)
0 (Neutral)
Score Calculation:
The total score is the sum of all 10 input signals divided by 10.
Score > 0.1 = Bullish
Score < -0.1 = Bearish
Between -0.1 and 0.1 = Neutral
Background Coloring:
Background colors dynamically adjust to reflect the long-term market regime.
Use Cases
Long-Term Positioning:
Identify periods of global expansion or contraction to position yourself accordingly.
Macro Confirmation:
Use LTPI in combination with medium-term (MTPI) and short-term tools for multi-timeframe confirmation.
Market Timing:
Alerts when LTPI crosses key thresholds help highlight the start of major bullish or bearish phases.
Dynamic Alerts:
Bullish Entry: LTPI score crosses above 0.1
Bearish Entry: LTPI score crosses below -0.1
Neutral Zone: Score moves back between -0.1 and 0.1
Conclusion
The Long-Term Trend Probability Indicator (LTPI – TOTAL) is a powerful tool for identifying long-term market phases across the entire crypto ecosystem. By focusing on long term trends and combining 10 inputs into a single probability score, it provides a clear macro perspective for strategic decision-making.
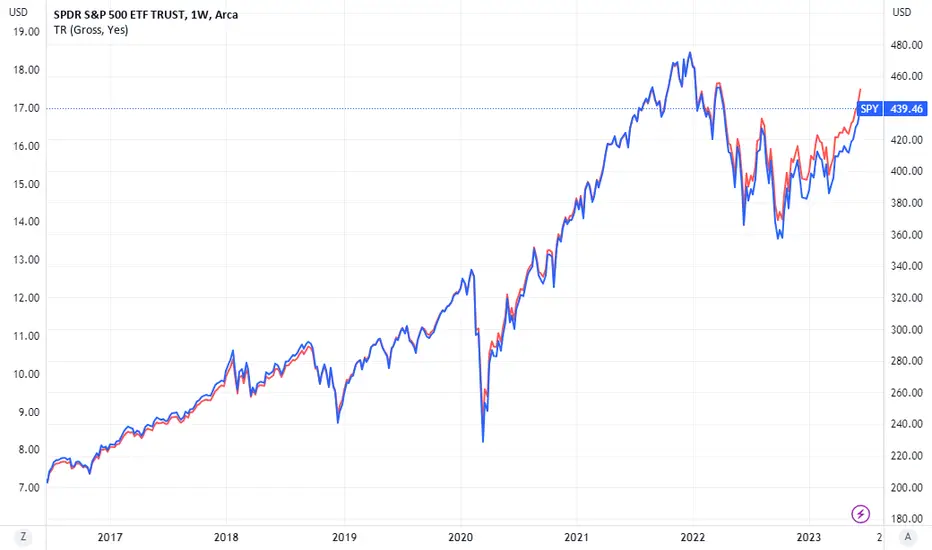
Total ReturnThis script calculates a Total Return index for stocks that shows the total performance of a stock, incorporating returns from both the share price and dividends.
To understand this, consider the situation where you invest in a 5% div stock and hold the position for 10 years. Assume at the end of 10 years, the price has gone up by 50%. A price chart will then show a 50% return, but in reality the investor has also received 50% of the initial investment in dividends, making his total return substantially more. Exactly how much more depends on whether the investor reinvested the dividends in the stock, or just held them as cash. If the former, his total return will be well over 100%; in the latter, his total return will be 100% exactly.
There are 2 input options:
- Dividend type: allows the user to choose "gross" or "net". Note that most stocks will have a "gross" data series whereas many will not have a "net" series.
- Reinvestment: allows the user to choose whether dividends should be reinvested in the stock ("Yes") or held in cash ("No").
Total return formula:
- With reinvestment: log((today's closing price + dividends paid today) / (yesterday's closing price))
- Without reinvestment: log(today's closing price / yesterday's closing price) + log (dividends paid thus far / first closing price)
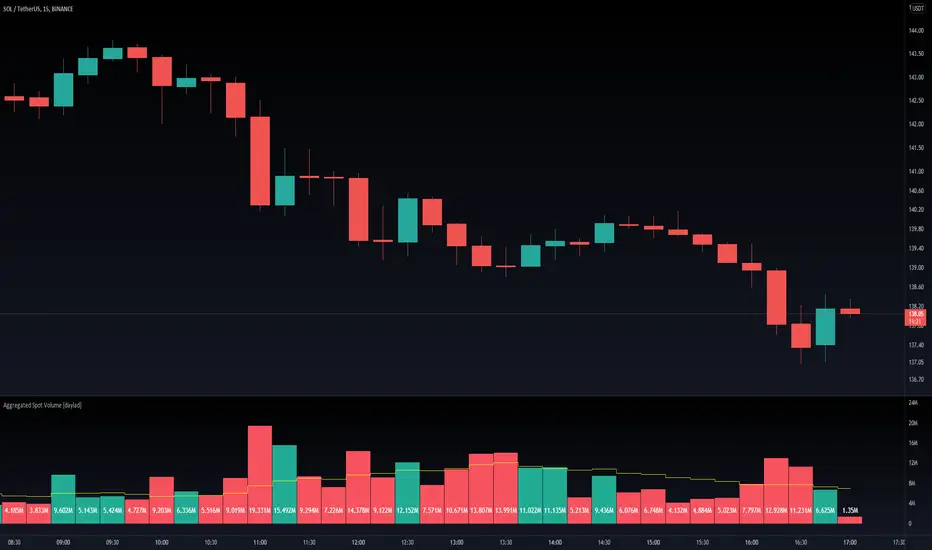
Aggregated Spot Volume [daylad]Works with any crypto chart! Automatically pulls and aggregates trading volume for the top stop pairs.
No need to manually update symbols, this indicator will detect if there is a matching symbol and add it.
Pulls data for the following pairs (when available):
COINBASE: + symbol + USD
COINBASE: + symbol + USDT
COINBASE: + symbol + EUR
BINANCE: + symbol + USDT
BINANCE: + symbol + BUSD
BINANCEUS: + symbol + USD
OKEX: + symbol + USDT
OKEX: + symbol + USDK
FTX: + symbol + USD
HUOBI: + symbol + USDT
BITFINEX: + symbol + USD
KRAKEN: + symbol + USD
KUCOIN: + symbol + USDT
CURRENCYCOM: + symbol + USD
POLONIEX: + symbol + USDT
UPBIT: + symbol + KRW
BITHUMB: + symbol + KRW
EXAMPLE -- If you are looking at the BINANCE:ADAUSDT chart, the indicator will automatically aggregate the volume from COINBASE:ADAUSD, COINBASE:ADAUSDT...etc... BINANCE:ADAUSDT...etc... BITHUMB:ADAKRW. If an exchange does not have a specific pair, then that pair returns 0 (does not add to the total).
If you have any questions feel free to ask. Happy trading!
Crypto swing correlation RSI and SMAThis is a crypto swing strategy, designed for long term periods and correlated pairs with crypto market total(or other coins used as correlation, however I recommend total of crypto or btc)
Its components are:
RSI with a very length
Correlation candles
SMA 9
Rules for entry:
For long : RSI is above 51 level and going higher and close of the candle is above the SMA
For short :RSI is below 49 and going lower and close of the candle is below the SMA
Rules for exit:
We exit when we encountered an opposite condition than the entry one, or based on take profit/stop loss levels.
If you have any questions let me know !

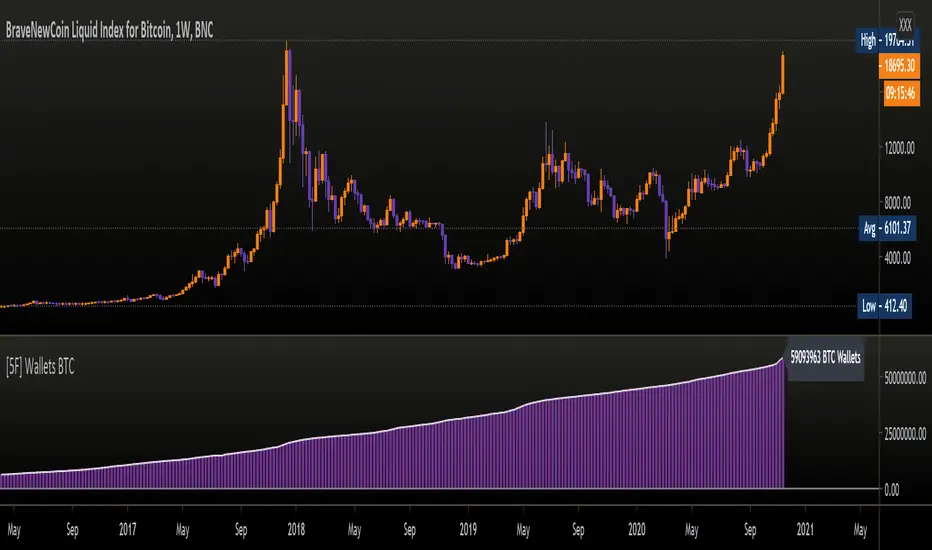
[5F ] Number of Bitcoin wallets-═════════════════════════-
This is a simple script that displays the total number of Bitcoins wallets based on the data provided by Quandl.
Use it in dayli resolution minimum
Refresh every day
Thanks to all Pinecoders who share their work with the community.
-═════════════════════════-
Candle Crawler V1 [Moon]Candle Crawler is designed to crawl back through candle and bar data to retrieve specific values of interest.
The first implementation shows
Total bars or candles on any specific time frame or asset to the beginning of the chart. This can be used for backtesting or looking for specific assets / time frames that have a lot of backtest data.
- *usually* More backtest data = More accurate strategy implementation or live testing.
Crawls back and counts Red vs Green candles in a defined period (the max is 4999 total bars).
Use this to identify bearish or bullish trends and assets.
- *hint* if an asset through time is leaning heavily one way, a long-only or short-only strategy may be worth investigating.
Plots days of the week on each candle within it's specific day (turned off by default).
Default view of Total Candles + R/G (note if you want to turn off the labels go to the "Style" tab and just uncheck "Labels" at the bottom).
Works on any asset or timeframe including stocks and forex.
Easily filter days on or off to identify specific patterns or trends (check the "days of the week" box for ON|OFF) or head to the "style" tab to customize days or colors.
Most precise on the Daily (D) timeframe, but applicable on any.
If interested send me a DM.

Oscillators EqualizerAn oscillator of the oscillators. This is one of my private indicators that implements a quantitative approach: it collects readings from internal oscillators and calculates scores for the selected metric.
Features
46 well-known oscillators
6 metrics ( Bands Breakouts , Overbought/Oversold , Above/Below Middle Line , Middle Line Crossovers , Above/Below Signal Line , Signal Line Crossovers )
Oscillators customization
Implemented oscillators
Relative Strength Index (by J. Welles Wilder)
Chande Momentum Oscillator (by Tushar S. Chande)
Intraday Momentum Index (by Tushar S. Chande)
Stochastic RSI (by Tushar S. Chande and Stanley Kroll)
Aroon Oscillator (by Tushar S. Chande)
R-Squared Index (by Tushar S. Chande and Stanley Kroll)
Forecast Oscillator (by Tushar S. Chande)
Relative Momentum Index (by Roger Altman)
Moving Average Convergence/Divergence (by Gerald Appel)
Connors RSI (by Larry Connors)
Rapid RSI (by Ian Copsey)
Relative Spread Strength (by Ian Copsey)
Vortex Indicator (by Etienne Botes and Douglas Siepman)
Random Walk Index (by Michael Poulos)
True Strength Index (by William Blau)
Stochastic Momentum Index (by William Blau)
Ergodic Oscillator (by William Blau)
Smoothed Rate Of Change (by Fred G. Schutzman)
TRIX (by Jack Hutson)
Pretty Good Oscillator (by Mark Johnson)
Choppiness Index (by Bill Dreiss)
Tick Line Momentum Oscillator (by Daniel E. Downing)
Price Momentum Oscillator
Relative Volatility Index (by Donald Dorsey)
Trend Trigger Factor (by M. H. Pee)
Trend Intensity Index (by M. H. Pee)
Trend Detection Index (by M. H. Pee)
Trend Continuation Factor (by M. H. Pee)
Relative Vigor Index (by John F. Ehlers)
Fisher Transform (by John F. Ehlers)
CG Oscillator (by John F. Ehlers)
Stochastic CG Oscillator (by John F. Ehlers)
Laguerre RSI (by John F. Ehlers)
Rocket RSI (by John F. Ehlers)
Recursive Median Oscillator (by John F. Ehlers)
Super Passband Filter (by John F. Ehlers)
Roofing Filter (by John F. Ehlers)
Ehlers Stochastic (by John F. Ehlers)
Fisherized Deviation-Scaled Oscillator (by John F. Ehlers)
Bollinger Bands %B (by John Bollinger)
Williams %R (by Larry Williams)
Ultimate Oscillator (by Larry Williams)
Money Flow Index (by Gene Quong and Avrum Soudack)
Commodity Channel Index (by Donald Lambert)
Ease of Movement (by Richard W. Arms)
Chaikin Money Flow (by Marc Chaikin)
