Tracks

15minMAThis script lets you plot a simple or exponential moving average from a specific time frame that you can select. For example, if you always want the Daily 50MA on your chart, regardless of what resolution your chart is on, this will do it. It's also color coded to show if it's rising or falling.


MACD TBBThis indicator works similar to the Tightened Bollinger Band (TBB) Strategy. Normally, when bollinger bands tighten, you look for the point where they widen and the direction of the price is often a breakout.
This indicator does the something similar, but using MACD, so you get other opportunities to get into plays. When the bollinger bands on the indicator tighten, wait for them to widen. The MACD line will turn red. The exit to the play is when the macd pulls away from the band and turns black again.
This indicator was built to help with some instructional material presented at www.optionsplayers.com
Let me know if you like the indicator or have any suggestions!

Combo Indicator V2This is an updated version of the Combo Indicator I previously published. It combines Bollinger Bands, 3 moving averages and 1 exponential moving average all into one chart. I use this indicators on most of my charts so wanted an easy way of combining them all.
SPECIAL BONUS
This indicator also includes a common Bollinger Band trading strategy built in. It was developed with options trading in mind for members over at OptionsPlayers.com. It tries to detect when the BB tunnel tightens, and then triggers an entry position when it detects the breakout. No strategy is 100% accurate, and there are some false positives, but it seems to work fairly well. However, do your own due diligence and use at your own risk.
The strategy can be turned on using a checkbox in the properties.

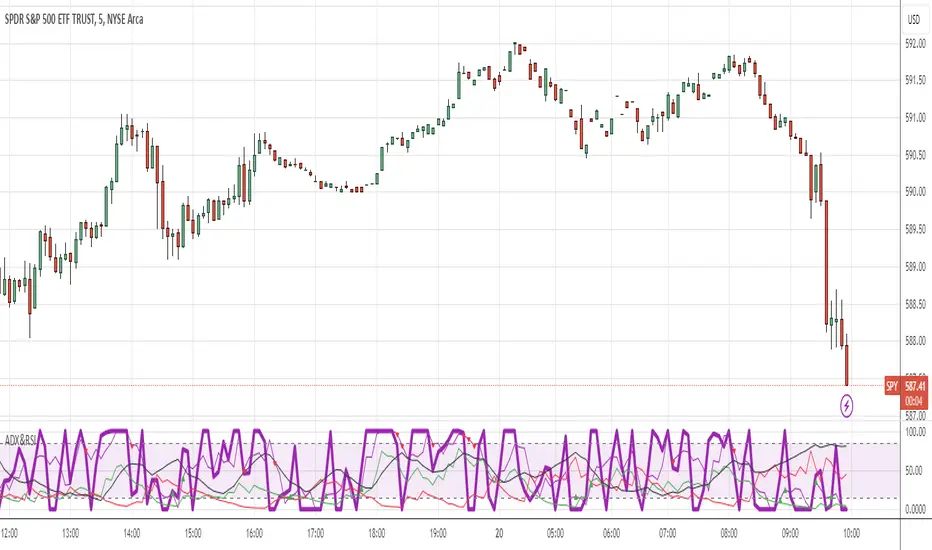
ADX and RSI ComboThis indicator combines two separate Simple RSI indicators so you can show different periods together, as well as an ADX indicator with DI+ and DI-. I prefer to use one indicator to show the whole thing, instead of stacking the individual indicators.