Volume Matrix Pro [ChartNation]Volume Matrix Pro is a comprehensive volume profile indicator that combines delta-colored volume distribution analysis with adaptive pivot detection and automated volume node identification. The indicator visualizes where institutional volume accumulated at specific price levels, providing traders with precise entry zones backed by actual trading data.
KEY FEATURES:
Delta-Colored Volume Profile: Displays volume distribution across price bins with automatic delta coloring - green bins show buyer dominance, red bins show seller control at each price level
High Volume Nodes (HVN) Detection: Automatically identifies and marks price levels with ≥80% of POC volume using yellow diamond markers - these act as magnetic support/resistance zones where institutions built positions
Low Volume Nodes (LVN) Detection: Marks thin volume areas with gray diamond markers - zones where price moves quickly with minimal friction, ideal for breakout targets
Adaptive Smart Pivots: ATR-based pivot detection that automatically adjusts length based on market volatility - catches more swings in low volatility, filters to major reversals in high volatility
Point of Control (POC) Line: Identifies the price level with maximum traded volume - the market's center of gravity. Line colors by delta: green when buyers dominated, red when sellers controlled the level
Value Area Lines: Dotted lines marking the 70% value area (configurable 50-98%) with delta-based coloring showing cumulative buyer/seller pressure within the range
Circle Pivot Markers: Clean visual markers at confirmed pivot points with translucent horizontal lines extending to current bar
Extend-Until-Touch: Pivot lines automatically retract when price touches them, keeping charts clean and showing active levels only
Dual Profile Modes: Left-side profile (default) or right-pinned bars ahead of price with fully customizable width and padding
Volume-Filtered Pivots: Only displays pivots with significant volume backing (≥20% of POC by default) - institutional turning points, not noise
HOW IT WORKS:
The indicator divides the lookback range (default 200 bars) into volume bins (default 50) and calculates total volume and delta (buying vs selling pressure) at each price level. Each bin is colored green if buyers dominated (close > open majority) or red if sellers controlled (close < open majority).
High Volume Nodes mark price levels where the most trading occurred - these become magnetic support/resistance zones. The Point of Control identifies the single price with maximum volume, acting as the market's gravitational center.
Smart Pivots use ATR to adapt to changing volatility, then filter against the volume profile. Only pivots with substantial volume backing are displayed, ensuring you see institutional turning points, not random noise.
RECOMMENDED SETTINGS:
Scalping (1-5 min): 100 lookback bars, 40 bins, 5-7 pivot length
Day Trading (15 min - 1 hour): 200 lookback bars, 50 bins, 10 pivot length (default)
Swing Trading (4 hour - Daily): 300-500 lookback bars, 60 bins, 15-20 pivot length
USAGE TIPS:
Enter long when price touches green HVN zones with adaptive pivot confirmation
Enter short when price reaches red HVN zones with pivot confirmation
Use POC as first target when entering below it, or as support backup when entering above
Watch for LVN zones as potential breakout acceleration areas
Combine green delta bins + HVN + pivot for highest-probability setups
WHAT MAKES THIS DIFFERENT:
Unlike traditional volume profiles, Volume Matrix Pro colors each bin individually by delta, giving granular insight into buyer/seller control at every price level. The adaptive pivot system adjusts automatically to volatility, while volume-filtering ensures only institutionally-backed turning points are displayed. High/Low Volume Node detection is fully automated with visual markers.
IMPORTANT NOTES:
This is a volume analysis tool - use with trend analysis and risk management
High Volume Nodes show where volume accumulated historically, not future support/resistance guarantees
Adaptive pivots adjust to volatility automatically but can still produce false signals in choppy markets
Best used as confirmation alongside price action, not as a standalone system
Profile recalculates on each bar to reflect current lookback range
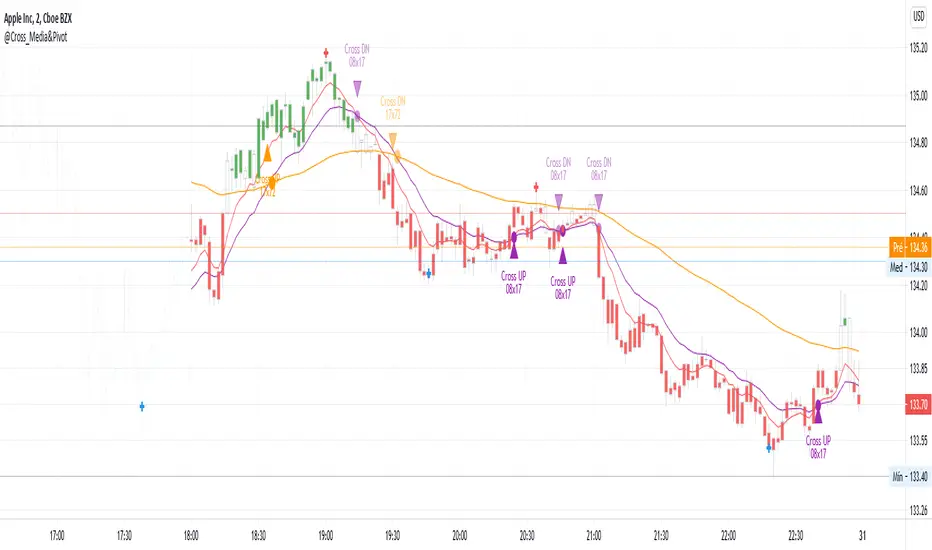
Tradeentry

@Cross_Media&Pivot&TRADE_Entry_and_ExitThis script uses the functions plot(), cross(), plotcandle(), pivothigh() and pivotllow(). You can see the candles in the color green, above EMA 72 (Exponetional Move Average), and the color red, below EMA72. You can identify the position of the crossing UP and DOWN of the EMA 08 x EMA 17, EMA 17 x EMA72. You can identify the TRADE ENTRY points with the pivot high and TRADE EXIT with the pivot Low.