Top-Down 8 Levels + Wick Alerts + H4 Box (Stable)Top-Down Analysis Box
This Indicator Helps You Do
Perform top-down analysis quickly
Identify HTF liquidity levels instantly
Spot wick taps (liquidity grabs) in real-time
Trade key institutional levels with confidence
Use H4 zones for direction and bias
Set alerts for high-probability reaction levels
Tradingindicators

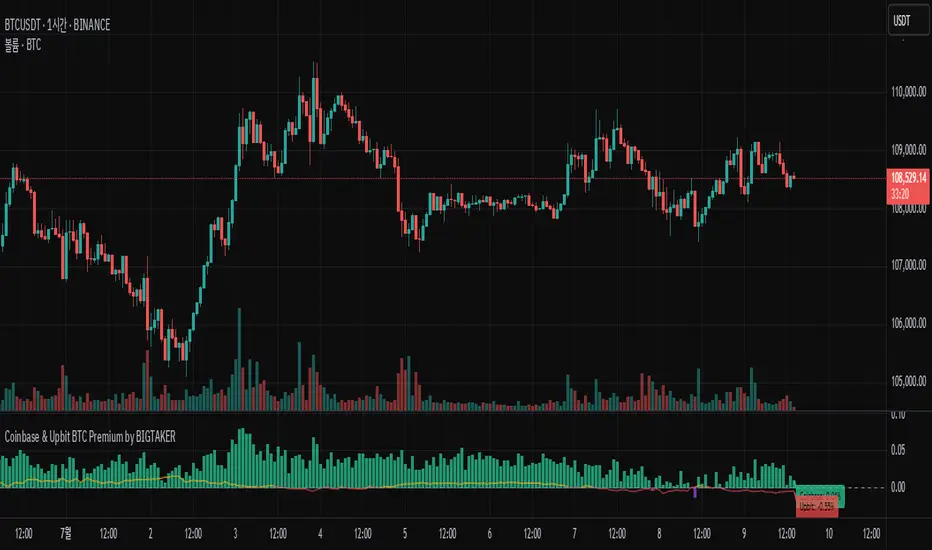
Coinbase BTC Premium by BIGTAKERBTC Premium Gap Analysis: Binance, Coinbase, Upbit
This indicator provides real-time analysis and visualization of the premium gap between the Binance BTCUSDT price and the BTC prices on Coinbase (BTCUSD) and Upbit (BTCKRW).
Key Features
Coinbase Premium Gap
Measures the price difference between Coinbase and Binance as a percentage.
To improve visibility, the Coinbase premium is visually amplified by 10x.
Upbit Premium Gap
Calculates the premium by comparing Upbit's BTCKRW price (converted into USD using the real-time USDKRW exchange rate) against Binance BTCUSDT.
Dynamic Color Coding
Premiums above 0% are displayed in lime green, indicating positive premiums.
Premiums below 0% are displayed in red, indicating discounts.
Real-Time Labels
Displays real-time premium values for both Coinbase and Upbit on the right side of the chart.
Additional Notes
Upbit premiums are adjusted for the USD/KRW exchange rate to ensure accurate USD-based comparison.
The Coinbase premium is magnified visually (10x) to better capture minor movements, while the actual premium value remains correctly displayed.
The indicator is optimized for traders who monitor global BTC market price disparities across major exchanges.
How to Use
Quickly track global BTC price discrepancies across Binance, Coinbase, and Upbit.
Detect "Kimchi Premium" conditions in the Korean market through Upbit premiums.
Analyze buying and selling pressure in North American markets through Coinbase premiums.
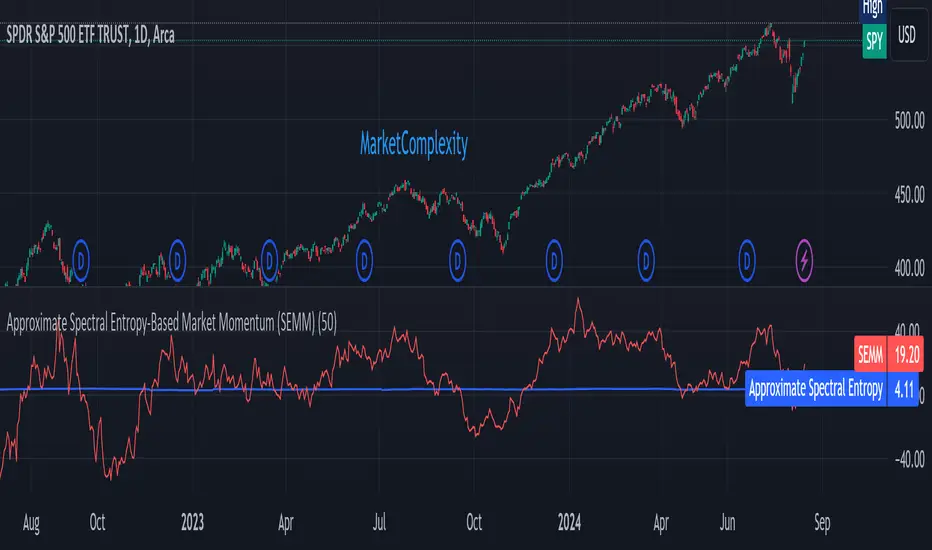
Approximate Spectral Entropy-Based Market Momentum (SEMM)Overview
The Approximate Spectral Entropy-Based Market Momentum (SEMM) indicator combines the concepts of spectral entropy and traditional momentum to provide traders with insights into both the strength and the complexity of market movements. By measuring the randomness or predictability of price changes, SEMM helps traders understand whether the market is in a trending or consolidating state and how strong that trend or consolidation might be.
Key Features
Entropy Measurement: Calculates the approximate spectral entropy of price movements to quantify market randomness.
Momentum Analysis: Integrates entropy with rate-of-change (ROC) to highlight periods of strong or weak momentum.
Dynamic Market Insight: Provides a dual perspective on market behavior—both the trend strength and the underlying complexity.
Customizable Parameters: Adjustable window length for entropy calculation, allowing for fine-tuning to suit different market conditions.
Concepts Underlying the Calculations
The indicator utilizes Shannon entropy, a concept from information theory, to approximate the spectral entropy of price returns. Spectral entropy traditionally involves a Fourier Transform to analyze the frequency components of a signal, but due to Pine Script limitations, this indicator uses a simplified approach. It calculates log returns over a rolling window, normalizes them, and then computes the Shannon entropy. This entropy value represents the level of disorder or complexity in the market, which is then multiplied by traditional momentum measures like the rate of change (ROC).
How It Works
Price Returns Calculation: The indicator first computes the log returns of price data over a specified window length.
Entropy Calculation: These log returns are normalized and used to calculate the Shannon entropy, representing market complexity.
Momentum Integration: The calculated entropy is then multiplied by the rate of change (ROC) of prices to generate the SEMM value.
Signal Generation: High SEMM values indicate strong momentum with higher randomness, while low SEMM values indicate lower momentum with more predictable trends.
How Traders Can Use It
Trend Identification: Use SEMM to identify strong trends or potential trend reversals. Low entropy values can indicate a trending market, whereas high entropy suggests choppy or consolidating conditions.
Market State Analysis: Combine SEMM with other indicators or chart patterns to confirm the market's state—whether it's trending, ranging, or transitioning between states.
Risk Management: Consider high SEMM values as a signal to be cautious, as they suggest increased market unpredictability.
Example Usage Instructions
Add the Indicator: Apply the "Approximate Spectral Entropy-Based Market Momentum (SEMM)" indicator to your chart.
Adjust Parameters: Modify the length parameter to suit your trading timeframe. Shorter lengths are more responsive, while longer lengths smooth out the signal.
Analyze the Output: Observe the blue line for entropy and the red line for SEMM. Look for divergences or confirmations with price action to guide your trades.
Combine with Other Tools: Use SEMM alongside moving averages, support/resistance levels, or other indicators to build a comprehensive trading strategy.