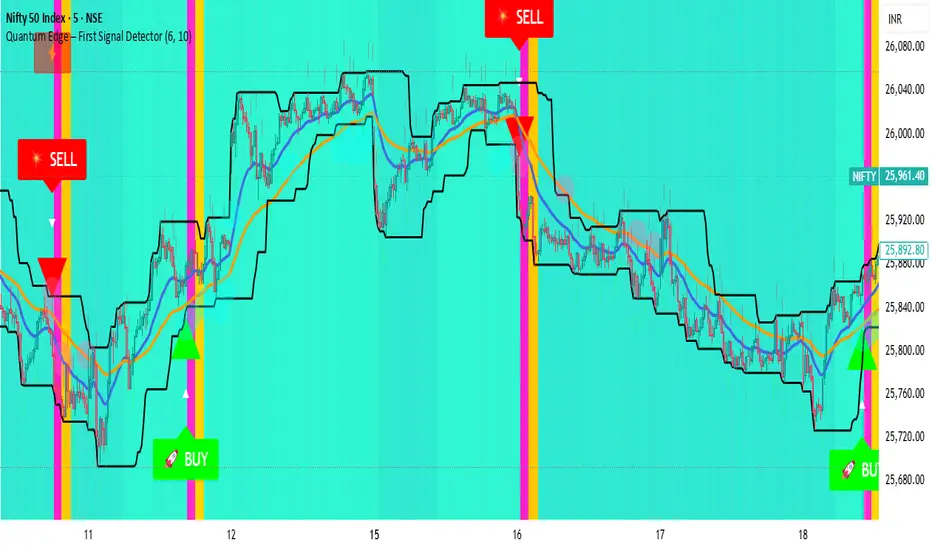
Quantum Edge First Signal DetectorQuantum Edge is a non-repainting, multi-confirmation indicator that detects the first high-probability BUY & SELL signals using momentum, trend, volume, volatility, and price-action voting logic.
🧠 About This Indicator
Quantum Edge – First Signal Detector is designed to solve one common trader problem:
too many late or repeated signals.
Instead of firing continuous entries, this indicator focuses only on the FIRST valid signal after a market shift — helping traders enter early, reduce noise, and avoid over-trading.
It uses a quantum-style voting engine where multiple independent market factors must align before a signal is confirmed.
⚙️ Core Logic (How It Works)
Each candle is evaluated using 6 independent factors:
RSI Momentum
Bullish when RSI > 50
Bearish when RSI < 40
Price Location
Price near recent highs or lows
Volume Expansion
Current volume above moving average
EMA Trend Direction
EMA 20 vs EMA 50
Candle Strength
Strong bullish or bearish candle bodies
Volatility Filter
ATR-based low volatility confirmation
Each factor gives 1 vote.
When minimum confirmations are met, a FIRST BUY or FIRST SELL signal is generated.
🚀 Key Features
✅ First-Signal-Only Logic
Only the first BUY or SELL after trend change
No repeated signals in the same direction
Built-in signal cooldown (user-controlled)
✅ Non-Repainting
Signals are confirmed on candle close
No future data, no repainting
✅ Smart Trend Filtering
EMA-based directional bias
Avoids weak counter-trend entries
✅ Advanced Visual System
Clear BUY / SELL triangles
Trend, volume & momentum backgrounds
Support & resistance zones
Market sentiment bar coloring
✅ Alert Support
Buy alert
Sell alert
📊 Best Timeframes
Scalping: 1m – 5m
Intraday: 5m – 15m
Swing Confirmation: 30m – 1H
Works on:
Forex
Crypto
Indices
Stocks
🎯 How to Trade (Simple Guide)
BUY Setup
✔ First BUY signal appears
✔ Trend is bullish
✔ Use nearby support as reference
SELL Setup
✔ First SELL signal appears
✔ Trend is bearish
✔ Use nearby resistance as reference
Always combine with risk management.
Disclaimer: This indicator is for educational purposes only and does not constitute financial advice. Trading involves risk. Use proper risk management.
趨勢分析

LockedEye ICT Confirmation EngineLockedEye Confirmation Engine ICT
Price-Action Confirmation • Non-Repaint • MTF Aligned
Overview
LockedEye Confirmation Engine is a price-action confirmation indicator designed to filter low-quality entries and enforce discipline. It does not predict market direction. It confirms when price has already shown intent and highlights whether that intent is strong, weak, or absent.
Built for traders who enter after structure, not on hope.
⸻
Core Features
1. Non-Repainting Confirmation
• Optional closed-candle mode
• Signals are based only on completed candles
• Once printed, signals do not change
This eliminates repainting and false early entries.
⸻
2. 2-Bar and 3-Bar Confirmation Logic
The indicator validates momentum using candle continuation:
• 2-Bar Confirmation
Faster, more aggressive confirmation
Best for scalping and early momentum
• 3-Bar Confirmation
Slower, stricter confirmation
Best for structure breaks and higher-confidence entries
⸻
3. Auto Mode (Volatility-Adaptive)
In Auto mode, the indicator automatically selects:
• 3-Bar confirmation during volatility expansion
• 2-Bar confirmation during low or contracting volatility
This allows the confirmation logic to adapt to market conditions instead of relying on fixed rules.
⸻
4. Clear Trade State Output
The engine outputs only three states:
• LONG – bullish confirmation present
• SHORT – bearish confirmation present
• WATCH – no confirmation yet
If no confirmation exists, the indicator explicitly tells you to stay out.
⸻
5. Multi-Timeframe Direction Table (MTF)
Includes an optional dashboard showing candle direction for:
• M5
• M15
• H1
• H4
Each timeframe displays:
• Directional arrow based on candle close vs open
• Subtle background bias for fast visual alignment
This helps prevent trading against higher-timeframe momentum.
⸻
6. Clean, Minimal UI
• Adjustable table position
• Subtle background colors
• Designed for fast decision-making without chart clutter
⸻
7. Built-In Alerts
Alert conditions included for:
• 2-Bar LONG / SHORT
• 3-Bar LONG / SHORT
• WATCH state
Useful for automation, notifications, or entry permission systems.
⸻
How to Use
This indicator is not a strategy and should not be used standalone.
Best used as a confirmation layer after:
• Break of structure
• Liquidity sweep
• Support / resistance reaction
• MA or trend-based bias
If the engine shows WATCH, the correct action is to wait.
⸻
Who This Is For
• Traders who want confirmation, not prediction
• Traders who value non-repaint logic
• Scalpers and swing traders who need momentum validation
• Anyone building a rules-based or systematic trading process

Scalping ~ Maniesh🔥 Fibonacci Scalping Indicator
This indicator is built for precision scalping using ACR (Average Candle Range) combined with Fibonacci-based premium & discount zones.
It helps traders identify high-probability reaction areas instead of chasing random moves.
🧠 Indicator Logic
Calculates ACR to understand current market volatility
Uses Fibonacci levels on the ACR range
Clearly marks Premium & Discount zones
Helps filter overextended price moves
Designed for reaction-based scalping, not blind entries
⏱ Best Timeframes
1m / 3m
Works best during London & New York sessions
📌 How to Use
Look for price reaching Fib
Wait for price reaction or confirmation
Enter scalps with tight stop-loss
Ideal for quick entries & partial exits
This indicator does not give buy/sell signals.
It is a framework tool to improve execution and timing.
⚠️ Disclaimer
Trading involves risk.
Always use proper risk management and backtest before live trading.

Liquidity Sweep Signals [cx.liquidityhunter]En Construcción
// Breakout bajista: rompe soporte con fuerza
if array.size(lsSupLevels) > 0
for i = array.size(lsSupLevels) - 1 to 0
if array.size(lsSupLevels) > i and i >= 0
lvl = array.get(lsSupLevels, i)
ln = array.get(lsSupLines, i)
// SIMPLE: Vela bajista grande que cierra por debajo del nivel
isBigBearCandle = close < open and lsBody > lsAtr * 0.3
closesBelow = close < lvl and high > lvl
noBottomWick = lsLowerWick < lsBody * 0.3
breakoutConfirm = isBigBearCandle and closesBelow and noBottomWick
breakoutCooldown = sweepCooldown * 2
if breakoutConfirm and bar_index > lastBearSweepBar + breakoutCooldown
lastBearSweepBar := bar_index
entrySell = close
slSell = lvl + lsAtr * lsSLBuffer
riskSell = slSell - entrySell
tp1Sell = entrySell - riskSell * lsRR1
tp2Sell = entrySell - riskSell * lsRR2
if lsShowLabels
bkTxt = "📉 BREAKOUT SELL Entry: " + str.tostring(entrySell, "#.##") + " SL: " + str.tostring(slSell, "#.##") + " TP1: " + str.tostring(tp1Sell, "#.##") + " TP2: " + str.tostring(tp2Sell, "#.##")
label.new(bar_index, low - lsAtr * 0.3, bkTxt, style = label.style_label_up, textcolor = color.white, size = size.small, color = lsBreakoutColor)
if lsShowSLTP
line.new(bar_index, slSell, bar_index + 20, slSell, color = color.red, width = 1, style = line.style_dashed)
line.new(bar_index, tp1Sell, bar_index + 20, tp1Sell, color = color.green, width = 1, style = line.style_dashed)
line.new(bar_index, tp2Sell, bar_index + 20, tp2Sell, color = color.lime, width = 1, style = line.style_dotted)
line.set_color(ln, lsBreakoutColor)
line.set_width(ln, 3)

Liquidity Void and Repair EngineLiquidity Void & Repair Engine
OVERVIEW
The Liquidity Void & Repair Engine is a high-fidelity institutional order flow tool designed to identify and track "Market Imbalances" or "Fair Value Gaps" (FVG). Unlike standard gap indicators that clutter the chart with every minor price jump, this engine uses Volatility-Adjusted Range Mapping to isolate high-conviction voids where price moved so rapidly that liquidity was left "unfilled."
The standout feature of this tool is its Active Repair Logic. The engine doesn't just draw static boxes; it monitors price action in real-time to determine when an imbalance has been "healed" by subsequent trading volume, providing a dynamic look at where the market has "unfinished business."
TECHNICAL LOGIC & ORIGINALITY
This script is published Open Source to contribute to the Pine Script community’s understanding of dynamic object management and order flow visualization.
ATR-Relative Filtering: To ensure only significant voids are plotted, the script uses a user-defined ATR (Average True Range) multiplier. This filters out market noise and focuses on institutional "impulse" moves.
Dynamic Box Management: Utilizing the Pine Script box array system, the script manages memory efficiently by updating existing objects rather than creating redundant ones.
The "Repair" Algorithm: The script tracks the high and low of every active void. When price action fully traverses the coordinates of a void, the script "seals" the box, visually marking the moment of liquidity equilibrium.
HOW TO USE
1. Identifying the "Magnet" (The Void)
When price moves aggressively, it leaves a "hole" in the auction.
Bullish Voids (Green): These represent areas where price surged so fast that buyers may still have unfilled orders sitting below. These act as Magnets for pullbacks.
Bearish Voids (Red): These represent areas where price plummeted, leaving a vacuum of selling pressure. These act as Magnets for relief rallies.
2. Trading the "Repair" Process
The Engine tracks how the market "repairs" these holes:
Partial Fill: If price enters a box but doesn't cross it, the "Magnet" is still active.
Full Repair: When a box is "sealed" (stops extending right), it indicates the imbalance is gone. If price "Seals" a green box and then bounces, it confirms the zone as Valid Institutional Support.
3. Confluence with the Trend
Continuation: In a strong uptrend, look for price to drop into a Green Bullish Void and find support. This is often the "Golden Entry" for trend followers.
Reversal Confirmation: If price ignores a Red Bearish Void and blasts right through it (sealing it instantly), it signals a massive shift in market regime and extreme bullish conviction.
USER SETTINGS
Lookback Period: How far back the engine searches for un-repaired gaps.
Min Gap Size (ATR %): Increase this to see only the "Major" institutional gaps; decrease it for a more granular intraday look.
Visual Styles: Fully customizable colors and transparency to match any chart theme (Dark/Light).
NOTES & DISCLAIMER
This script is a visualization of historical price imbalances and is intended for educational purposes only. It does not provide trade signals, entry/exit points, or financial advice. All trading involves risk.

Relative Strength Table📊 RRG Quadrant Scanner - Options Trading Market Direction Tool
A powerful Relative Rotation Graph/Table (RRG) dashboard designed to help OPTIONS TRADERS identify market direction, select optimal strikes, and time entries with precision. Track up to 8 symbols against any benchmark to determine bullish/bearish bias and rotation momentum.
---
🎯 WHY OPTIONS TRADERS NEED THIS
Unlike stock traders who can hold losing positions indefinitely, options traders face:
❌ Time decay (theta)
❌ Directional risk (delta)
❌ Volatility changes (vega)
❌ Limited time to be right
This indicator solves these challenges by showing you:
✅ Which direction momentum is flowing (calls vs puts)
✅ Which symbols/sectors have strongest trends (high probability setups)
✅ When rotation is happening (timing entries/exits)
✅ Market breadth for directional confirmation
---
🔥 HOW RRG QUADRANTS GUIDE OPTIONS TRADING
🟢 LEADING QUADRANT (Top Right) - BULLISH BIAS
What it means:
• Strong uptrend vs benchmark
• Accelerating momentum
• High relative strength
Options Strategies:
✅ BUY CALLS (ITM/ATM for safer, OTM for aggressive)
✅ SELL CASH-SECURED PUTS (collect premium on strong stocks)
✅ BULL CALL SPREADS (defined risk directional plays)
✅ LONG CALL DIAGONALS (capture continued uptrend)
Direction Signal: STRONG BULLISH
• Multiple symbols in Leading = broad market strength
• Index options: favor call side
• Stock options: bullish strategies on individual leaders
---
🔵 IMPROVING QUADRANT (Top Left) - EARLY BULLISH
What it means:
• Currently underperforming BUT gaining momentum
• Early reversal signal
• Rotation from weak to strong
Options Strategies:
✅ BUY CALLS with longer expiry (give time to develop)
✅ BULL PUT SPREADS (defined risk as support builds)
✅ SELL PUTS at support (premium collection on improving stocks)
✅ CALENDAR SPREADS (benefit from time and momentum shift)
Direction Signal: EMERGING BULLISH
• Symbols moving Lagging → Improving = early buy signal
• Best for patient options traders
• Use longer DTE (45-60 days) to allow rotation to complete
• Watch for move into Leading quadrant for confirmation
---
🔴 LAGGING QUADRANT (Bottom Left) - BEARISH BIAS
What it means:
• Weak relative strength
• Declining momentum
• Persistent underperformance
Options Strategies:
✅ BUY PUTS (directional bearish play)
✅ BEAR CALL SPREADS (defined risk on weakness)
✅ SELL COVERED CALLS (if stuck in position)
✅ PUT DEBIT SPREADS (cheaper than naked puts)
Direction Signal: STRONG BEARISH
• Multiple symbols in Lagging = market weakness
• Avoid bullish strategies entirely
• Index options: favor put side
• Exit existing long calls immediately
---
⚫ WEAKENING QUADRANT (Bottom Right) - EARLY BEARISH
What it means:
• Currently strong BUT losing momentum
• Topping signal
• Rotation from strong to weak
Options Strategies:
✅ SELL CALLS (initiate bearish bias)
✅ BEAR PUT SPREADS (cheaper than naked puts)
✅ CLOSE LONG CALLS (take profits before decay accelerates)
✅ PROTECTIVE PUTS (if holding stock positions)
✅ SHORT STRADDLES/STRANGLES (if expecting range-bound)
Direction Signal: EMERGING BEARISH
• Symbols moving Leading → Weakening = profit-taking signal
• Close bullish positions EARLY
• Initiate bearish strategies
• Watch for move into Lagging for confirmation of downtrend
---
🎯 MARKET DIRECTION CONFIRMATION FOR INDEX OPTIONS
Trading NIFTY/BANKNIFTY/SPX Options? Use this way:
📊 Track These Symbols Against Benchmark:
• Major sectors: Finance, IT, Energy, Auto, Pharma
• Top stocks: RELIANCE, HDFCBANK, INFY, TCS, etc.
• Benchmark: NIFTY or BANKNIFTY
🟢 BULLISH INDEX BIAS (Buy Calls/Sell Puts)
When you see:
• 60%+ symbols in Leading + Improving quadrants
• Financial sector in Leading (indicates BANKNIFTY strength)
• IT sector in Leading (indicates NIFTY strength)
• Few symbols in Lagging
Strategy: Aggressive call buying, put selling, bull spreads
🔴 BEARISH INDEX BIAS (Buy Puts/Sell Calls)
When you see:
• 60%+ symbols in Lagging + Weakening quadrants
• Key sectors rotating to Weakening
• Broad-based weakness across watchlist
Strategy: Put buying, bear spreads, avoiding new longs
⚖️ NEUTRAL/ROTATION PHASE (Iron Condors/Strangles)
When you see:
• Symbols evenly distributed across quadrants
• No clear cluster in any one quadrant
• Conflicting signals between sectors
Strategy: Range-bound strategies, avoid directional bets, reduce position size
---
💡 OPTIONS TRADING USE CASES
🎯 Case 1: Earnings Play Setup
Before earnings, check if stock is in:
• Leading = bullish bias, buy calls
• Improving = emerging strength, cautious calls
• Weakening = avoid or buy puts
• Lagging = strong puts
🎯 Case 2: Weekly Options Direction
Monday morning setup:
• Check sector quadrants vs benchmark
• Leading sectors = focus call trades there
• Weakening sectors = focus put trades
• Adjust delta exposure based on quadrant distribution
🎯 Case 3: Spread Selection
For credit spreads:
• Sell puts on Leading/Improving symbols (bullish)
• Sell calls on Weakening/Lagging symbols (bearish)
• Iron condors when symbols are scattered (no clear direction)
🎯 Case 4: Portfolio Hedging
If holding calls:
• Watch symbols move Leading → Weakening = add protective puts
• If 50%+ watchlist enters Weakening = hedge entire portfolio
If holding puts:
• Watch symbols move Lagging → Improving = close puts early
• If broad rotation to Improving = exit bearish positions
🎯 Case 5: Theta Decay Management
Leading quadrant = hold calls longer (trend supports you)
Weakening quadrant = close calls early (decay + downside risk)
Improving quadrant = be patient with calls (need time to develop)
Lagging quadrant = hold puts or exit quickly if rotation starts
---
📈 SECTOR ROTATION FOR OPTIONS STOCK SELECTION
Instead of trading index options, use quadrants to pick individual stocks:
Setup Example - NSE Options:
Symbols: RELIANCE, HDFCBANK, INFY, TCS, SBIN, ICICIBANK, TATAMOTORS, BAJFINANCE
Benchmark: NIFTY
Monday Strategy Session:
1. Check which stocks are in Leading quadrant
2. Focus call trades ONLY on Leading stocks
3. Check which stocks are in Weakening/Lagging
4. Focus put trades on those
5. Ignore stocks in unclear quadrants (save capital)
This approach:
✅ Increases win rate (trading with momentum)
✅ Reduces losses (avoiding weak stocks)
✅ Improves timing (catch early rotations)
---
🔥 REAL TRADING SCENARIOS FOR OPTIONS
📊 Scenario 1: Strong Bullish Market
Quadrant Status:
• Leading: 5 symbols
• Improving: 2 symbols
• Weakening: 1 symbol
• Lagging: 0 symbols
Options Action:
✅ Aggressive call buying on index
✅ Bull call spreads on leading stocks
✅ Sell puts on improving stocks
✅ Avoid bearish strategies
✅ Larger position sizes (conviction high)
---
📊 Scenario 2: Rotation/Choppy Market
Quadrant Status:
• Leading: 2 symbols
• Improving: 2 symbols
• Weakening: 2 symbols
• Lagging: 2 symbols
Options Action:
⚠️ AVOID directional bets
✅ Iron condors/strangles (profit from range)
✅ Calendar spreads (volatility plays)
✅ Smaller position sizes
✅ Wait for clearer rotation signal
---
📊 Scenario 3: Bearish Reversal
Quadrant Status:
• Leading: 1 symbol
• Improving: 0 symbols
• Weakening: 3 symbols
• Lagging: 4 symbols
Options Action:
✅ Buy puts on index
✅ Bear call spreads on weakening stocks
✅ CLOSE all long calls immediately
✅ Sell covered calls if stuck in stocks
✅ Increase hedge positions
---
📊 Scenario 4: Early Recovery
Quadrant Status:
• Leading: 1 symbol
• Improving: 4 symbols (moving from Lagging)
• Weakening: 1 symbol
• Lagging: 2 symbols
Options Action:
✅ Buy calls with 45-60 DTE (give time to develop)
✅ Bull put spreads on improving stocks
✅ Small position sizes initially
✅ Scale in as symbols move to Leading
✅ Close remaining bearish positions
---
🎯 TIMING ENTRY/EXIT WITH QUADRANTS
📍 BEST CALL ENTRIES:
1. Symbol moves Improving → Leading (momentum confirmed)
2. 70%+ watchlist in Leading/Improving (broad strength)
3. Key sector enters Leading (focused strength)
📍 BEST PUT ENTRIES:
1. Symbol moves Weakening → Lagging (downtrend confirmed)
2. 70%+ watchlist in Weakening/Lagging (broad weakness)
3. Leading symbols suddenly drop to Weakening (reversal)
📍 EXIT SIGNALS:
Calls: Close when symbol enters Weakening
Puts: Close when symbol enters Improving
Both: Take profits at 50-70% max gain if rotation unclear
---
⚙️ SETUP FOR OPTIONS TRADERS
For NIFTY Options Traders:
• Symbols: Top 8 NIFTY stocks (RELIANCE, HDFCBANK, INFY, etc.)
• Benchmark: NIFTY
• Window: 20 periods
• Timeframe: Daily chart
• Use: Gauge NIFTY direction
For BANKNIFTY Options Traders:
• Symbols: Banking stocks (HDFCBANK, ICICIBANK, SBIN, KOTAKBANK, AXISBANK)
• Benchmark: BANKNIFTY
• Window: 20 periods
• Use: Gauge BANKNIFTY direction
For Stock Options Traders:
• Symbols: Your watchlist of optionable stocks
• Benchmark: Relevant sector index
• Window: 10-20 periods
• Use: Pick strongest/weakest for directional trades
---
🎓 OPTIONS TRADING RULES USING QUADRANTS
✅ Rule 1: Only buy calls on Leading/Improving stocks
✅ Rule 2: Only buy puts on Weakening/Lagging stocks
✅ Rule 3: Exit calls when stock enters Weakening
✅ Rule 4: Exit puts when stock enters Improving
✅ Rule 5: Use longer DTE when trading Improving/Weakening (rotation takes time)
✅ Rule 6: Use shorter DTE when trading Leading/Lagging (established trends)
✅ Rule 7: If 70%+ watchlist in one side = strong directional bias
✅ Rule 8: If symbols scattered = reduce position sizes, play neutral
---
🏆 ADVANTAGES FOR OPTIONS TRADERS
✅ HIGHER WIN RATE
Trade only symbols with clear momentum direction
✅ BETTER TIMING
Catch rotations early = maximize profit potential
✅ REDUCED THETA DECAY LOSSES
Don't hold calls on weakening stocks (double loss)
✅ CLEARER MARKET BIAS
Know if market is bullish/bearish/neutral
✅ PORTFOLIO ALIGNMENT
Match your delta exposure to market direction
✅ EARLY WARNING SYSTEM
Spot rotations before price breaks down/up
✅ RISK MANAGEMENT
Exit positions before momentum shifts against you
---
📚 COMBINING WITH OTHER ANALYSIS
This indicator works best when combined with:
📊 Technical Analysis
• Support/Resistance for strike selection
• Chart patterns for entry timing
• Volume for confirmation
📈 Volatility Analysis
• IV Rank for premium selling decisions
• VIX/India VIX for overall market risk
⏰ Time Analysis
• Check quadrants before weekly expiry
• Align DTE with expected rotation speed
💰 Greeks Management
• High delta on Leading symbols (directional confidence)
• Low delta on Improving symbols (early, needs time)
• Negative delta on Weakening/Lagging (bearish bias)
---
⚠️ WHAT THIS INDICATOR DOESN'T DO
❌ Doesn't predict exact option prices
❌ Doesn't tell you which strike to buy
❌ Doesn't replace risk management
❌ Doesn't account for news/events
❌ Doesn't consider implied volatility
❌ Doesn't guarantee winning trades
It DOES give you:
✅ Market direction bias
✅ Symbol selection edge
✅ Rotation timing awareness
✅ Risk/reward framework
---
🎯 BOTTOM LINE FOR OPTIONS TRADERS
Stop fighting momentum. Stop buying calls on weakening stocks. Stop holding positions through rotations.
Instead:
• Check quadrants BEFORE entering trades
• Buy calls only on Leading/Improving
• Buy puts only on Weakening/Lagging
• Exit when rotation signals change
• Adjust position size based on breadth
This simple framework can dramatically improve your options trading win rate and reduce catastrophic losses from holding through momentum reversals.
---
⭐ START TRADING WITH THE TREND
Add this RRG Quadrant Scanner and align your options trades with market rotation - not against it!

Precision Trendlines - Relevant Current TFPrecision Structural Trendlines (Current TF)
Overview
The Precision Structural Trendlines indicator is a high-performance price action tool designed for traders who rely on market structure and trend convergence. Unlike standard trendline scripts that clutter the chart with every possible connection, this indicator strictly follows professional structural rules—connecting Lower Highs for resistance and Higher Lows for support.
Key Features
Structural Integrity: The engine ensures that resistance lines are only drawn during bearish sequences (Lower Highs) and support lines during bullish sequences (Higher Lows), aligning with core Price Action principles.
Dynamic Relevance Filter: Solve the "web of lines" problem. By default, the script only shows trendlines that are currently relevant to price. As price moves away from old trends, they fade out, keeping your workspace clean.
Zero Drift Synchronization: Built using absolute time-anchoring (xloc.bar_time), ensuring that trendlines stay perfectly "glued" to the candle wicks regardless of how much you scroll or zoom.
Customizable Aesthetics: Choose between Random Dark Colors to easily distinguish overlapping trends or a Static Color for a unified look. Global width controls allow for instant visibility adjustments.
How to Use
Trend Confirmation: Use the Minimum Points setting. Set it to 2 for aggressive, early trend detection, or 3 to only see lines that have been validated by multiple touches.
Major vs. Minor Swings: Adjust the Pivot Strength. A value of 30 (default) captures significant intraday turns, while 20+ is ideal for identifying major swing structure.
Relevance Buffer: Tune the Price Buffer % to determine how close price must be to a historical trendline before it reappears on your chart.
Settings Breakdown
Minimum Points: Number of pivot points required to anchor a line.
Pivot Strength: The "look-left/look-right" requirement to confirm a peak or valley.
Validation Tolerance: The vertical buffer allowed for a 3rd point to "hit" the trendline.
Show Relevant Only: Toggles the visibility filter (highly recommended for high-volume traders).

Sen Regression ChannelSen Regression Channel
OVERVIEW
The Sen Regression Channel is a trend-structure visualization tool built on the Theil–Sen estimator, a median-based regression method designed to reduce sensitivity to price outliers. Unlike traditional least-squares regression channels, this approach anchors trend using the most representative slope across the lookback period, resulting in a more stable and noise-resistant structure.
TECHNICAL LOGIC & ORIGINALITY
To protect the proprietary implementation of the median-slope engine and adaptive band construction, this script is published as Protected.
Median Slope Engine
Calculates the Theil–Sen slope by evaluating the median rate of change across the lookback window, producing a trendline less distorted by extreme candles or transient volatility.
Adaptive Volatility Bands
Channel width can be derived from either Standard Deviation or ATR, allowing the envelope to adjust dynamically to changing volatility regimes.
Multi-Reference Context (Optional)
VWAP and EMA/SMA overlays can be enabled to compare the median regression structure against commonly used price and volume-weighted references.
HOW TO USE (EDUCATIONAL)
This tool is designed to help analyze trend quality and market structure, not to generate trade signals.
Trend Direction & Stability
A sustained upward or downward slope of the median regression line indicates directional structure with reduced noise sensitivity.
Volatility Expansion Zones
Price closing outside the channel bands highlights volatility expansion relative to the median trend and may signal regime change.
Mean-Reversion Context
Price oscillation between the median line and bands reflects balanced conditions; movement toward the outer bands indicates relative extension.
VWAP Confluence
Alignment between the regression midline and VWAP may highlight areas of consensus value.
USER INPUTS
Lookback Period – Sets the window for the median slope calculation
Band Multiplier – Scales the channel width
Band Method – Standard Deviation or ATR-based envelope
Visual Overlays – Toggle VWAP, midline, and cloud transparency
NOTES
This script is a historical charting and visualization tool for educational purposes only.
It does not provide trade signals, alerts, or financial advice.
All values are calculated in real time using available chart data.
Market State & Candlestick Patterns Made in ChinaIndicator Overview
The Market State & Candlestick Patterns Master (MSCP-Master) is a comprehensive, all-in-one technical analysis indicator that combines real-time market state identification with multiple candlestick pattern recognition. This powerful tool not only identifies classic price action patterns but also adapts their significance based on the current market volatility environment, providing context-aware trading signals for smarter decision-making.
Core Innovation: Adaptive Pattern Recognition
Traditional candlestick pattern indicators work in isolation, often giving false signals in the wrong market conditions. MSCP-Master revolutionizes this approach by:
First assessing market state (Low Volatility/Ranging/High Volatility) through a multi-dimensional scoring system
Then applying different confirmation criteria for each pattern based on the detected market state
Finally providing context-aware signals that are more reliable because they consider the broader market environment
Three-Layer Analysis System
Layer 1: Market State Identification (The Foundation)
Uses four key metrics to calculate a comprehensive market state score:
ATR Relative Volatility: Measures current volatility against historical norms
Bollinger Band Width: Identifies contraction/expansion periods
Amplitude Analysis: Evaluates recent price range activity
Momentum Strength: Assesses directional movement power
Based on the composite score, the market is classified into:
🔵 Low Volatility: Tight ranges, potential for breakout
🟡 Ranging: Normal oscillation within established bounds
🟢 High Volatility: Wide ranges, strong momentum moves
Layer 2: Pattern Recognition With Context Adaptation
Each pattern uses different confirmation logic based on market state:
High Volatility State: Uses SMA-based trend confirmation (Long/Short SMA comparison)
Low Volatility/Ranging States: Uses ATR-adjusted threshold confirmation (dynamic based on current vs. baseline volatility)
This adaptive approach means patterns are only considered valid when they make sense for the current market environment.
Layer 3: Comprehensive Pattern Library
The indicator identifies 10+ critical candlestick patterns:
Engulfing Patterns (Bullish/Bearish) with Harami confirmation requirement
Outside Bars (Bullish/Bearish) with customizable engulfing criteria
False Breakouts (Bullish/Bearish) with sophisticated tracking of "trap" moves
Hammer/Inverted Hammer with ATR-adjusted significance thresholds
Doji Variations (Standard, Dragonfly, Gravestone) with precise mathematical definitions
Three Soldiers Method (Enhanced) with dual absolute/relative strength measurements
Enhanced Three Soldiers Method - Beyond Traditional Interpretation
Unlike traditional "Three White Soldiers/Black Crows" patterns that rely on simple visual recognition, our enhanced version introduces:
Quantifiable Strength Metrics: Each candle must meet customizable thresholds for both absolute price movement (%) and relative efficiency (close-to-open vs. total range)
Two Signal Types: Preparation signals (amber) for early warnings and True signals (green/red) for confirmed breakouts
Breakout Confirmation: "True signals" only trigger when price breaks above/below recent signal cluster extremes
Full Customization: All parameters adjustable to match your trading style and market conditions
Key Features
🎯 Context-Aware Signals: Patterns are validated differently in high vs. low volatility markets
📊 Real-Time Market State: Clear color-coded background shows current market conditions
🔍 Multiple Confirmation Methods: Uses both SMA trend-following and ATR-adjusted threshold approaches
⚙️ Fully Customizable: Every parameter adjustable across all pattern types and market state calculations
📈 Comprehensive Visualization: Color-coded labels, reference lines, and information tables
Strategic Application
Preparation Signals: Use amber "single candle" or "three candle" signals to prepare for potential moves
True Signals: Green/red "True" signals indicate confirmed momentum - ideal for main entries
Market State Alignment: Trade with the market's character - aggressive in high volatility, cautious in low volatility
Pattern Convergence: Look for multiple patterns confirming the same direction for higher probability setups
Parameter Groups (Organized for Easy Customization)
Market State Identification: ATR, Bollinger Band, Amplitude, Momentum parameters
Pattern-Specific Settings: Engulfing, Outside Bars, False Breakouts, Hammer/Doji patterns
Three Soldiers Method: Absolute/Relative strength thresholds, lookback periods
Confirmation Logic: SMA lengths, ATR adjustment factors, sensitivity settings

F&O Auto Option Chain Pro🎯 Auto Option Chain - Live NSE F&O Dashboard
Transform your options trading experience with instant access to complete option chain data - right on your TradingView charts!
---
✨ WHAT YOU GET
See the complete option chain whenever you're viewing NSE options. No setup required - it just works!
📊 Live Data Display:
• Last Traded Price (LTP) for all strikes
• Trading Volume in lots
• VWAP levels
• Intraday price changes
• Put-Call Ratio (PCR) analysis
• ATM strike highlighting
🎯 Two Ways to Use:
AUTO MODE - Zero Setup
Simply view any NSE option like NIFTY or BANKNIFTY options, and the complete chain appears instantly around your selected strike.
MANUAL MODE - Universal Access
Use on any chart - equity, index, or options. Just select your underlying symbol, expiry date, and reference strike.
---
💼 SUPPORTED MARKETS
✅ NSE Index Options
• NIFTY
• BANKNIFTY
• FINNIFTY
• MIDCPNIFTY
✅ NSE Stock Options (200+ symbols)
• RELIANCE, HDFCBANK, TCS, ICICIBANK
• SBIN, INFY, ITC, BHARTIARTL
• KOTAKBANK, HINDUNILVR, MARUTI
• AXISBANK, BAJFINANCE, TATAMOTORS
• WIPRO, LT, HCLTECH, SUNPHARMA
• And 180+ more popular F&O stocks!
All symbols work seamlessly with correct strike intervals.
---
🎨 CUSTOMIZATION
Dashboard Position:
Choose from 9 screen positions to keep your charts clean and visible
Visual Style:
• 4 font sizes for comfortable viewing
• Custom colors for ATM strikes
• Color-coded profit/loss indicators
• Adjustable transparency
Data Range:
Control how many strikes you want to see (up to 8 strikes above and below ATM)
---
🔥 PERFECT FOR
✓ Intraday Option Traders
See live premium changes and volume shifts in real-time
✓ Spread Builders
Compare multiple strikes instantly for Iron Condors, Butterflies, and other strategies
✓ Options Sellers
Track volume concentration and decay throughout the trading day
✓ Market Analysts
Study option flow patterns and Put-Call Ratios for sentiment analysis
✓ Swing Traders
Plan weekly positions with complete visibility of the option chain
✓ Scalpers
Quick strike selection with live data updates
---
💡 TRADING APPLICATIONS
🎯 Identify Key Levels
High volume strikes often act as support and resistance zones
📊 Sentiment Analysis
Put-Call Ratio shows whether traders are positioned bullish or bearish
⚡ Premium Tracking
Watch real-time option value changes during volatile market moves
🔍 Spread Trading
Visual comparison makes it easy to select optimal strike combinations
💰 Entry Point Selection
Compare multiple strikes before entering positions
🏦 Smart Money Tracking
VWAP reveals institutional trading levels
---
📱 HOW TO USE
Getting Started - Auto Mode:
1. Open any NSE option chart
2. Add "Auto Option Chain" indicator
3. Complete chain displays automatically
4. Start trading with full visibility!
Alternative - Manual Mode:
1. Open any NSE chart (index, equity, or option)
2. Add the indicator
3. Switch to Manual mode
4. Enter your symbol (e.g., NIFTY)
5. Set expiry date in YYMMDD format (e.g., 251226 for Dec 26, 2025)
6. Set approximate ATM strike
7. Option chain appears instantly!
---
🌟 KEY BENEFITS
✅ CONVENIENCE
No need to switch between TradingView and external option chain websites
✅ SPEED
Instant data updates with every price tick
✅ EFFICIENCY
All strikes visible at once - no scrolling through multiple pages
✅ ACCURACY
Real-time data synchronized with your chart timeframe
✅ SIMPLICITY
Works automatically on option charts, manually on others
✅ FLEXIBILITY
View option chains while analyzing spot/futures charts
✅ INSIGHT
PCR and volume data aid better trading decisions
---
⚠️ IMPORTANT INFORMATION
• Works exclusively with NSE options (Indian market)
• Data quality depends on your TradingView subscription
• Best performance on 1-minute to daily timeframes
• Displays up to 8 strikes on each side of ATM
• Requires active market hours for live data
---
🎓 TIPS FOR SUCCESS
💡 Start with Auto mode when trading specific options
💡 Use Manual mode for pre-market planning
💡 Adjust strike range based on market volatility
💡 Position dashboard where it doesn't block price action
💡 Monitor PCR for early sentiment shifts
💡 Track volume spikes for potential breakout levels
💡 Compare VWAP with LTP to gauge fair value
---
🏆 WHAT MAKES THIS DIFFERENT
Unlike basic option indicators that show single strikes or delayed data:
✅ Shows complete chain around ATM
✅ Updates in real-time with your chart
✅ Works automatically when viewing options
✅ Also works manually on any chart type
✅ Pre-configured for 200+ popular stocks
✅ Includes advanced metrics (PCR, VWAP, Volume in lots)
✅ Clean, professional interface
---
📈 REAL TRADER BENEFITS
"See the whole picture before entering trades"
Complete chain visibility helps you select optimal strikes
"No more tab switching"
Everything you need is right on your chart
"Faster decisions"
Instant data comparison across multiple strikes
"Better risk management"
Understand where volume and open interest are concentrated
"Professional-grade analysis"
Tools previously available only on premium platforms
---
🎯 IDEAL FOR THESE STRATEGIES
✓ Naked Call/Put selling
✓ Covered Calls
✓ Protective Puts
✓ Bull/Bear Call Spreads
✓ Bull/Bear Put Spreads
✓ Iron Condors
✓ Iron Butterflies
✓ Straddles
✓ Strangles
✓ Calendar Spreads
✓ Ratio Spreads
---
⭐ YOUR SUCCESS IS MY GOAL
If you find this indicator valuable:
• Leave a rating to help others discover it
• Share feedback in the comments
• Suggest improvements for future updates
• Follow for new indicator releases
💬 Need Help?
Drop a comment with your questions - I respond to all users!
🔔 Stay Updated
Follow to get notified about improvements and new features
---
⚖️ DISCLAIMER
This indicator is provided for educational and informational purposes only. It displays market data but does NOT provide trading advice or recommendations.
Options trading involves substantial risk and is not suitable for all investors. You can lose more than your initial investment. Past performance does not guarantee future results.
Always:
• Conduct your own research
• Understand options risks fully
• Consult a licensed financial advisor
• Trade only with risk capital
• Use proper position sizing
• Implement stop losses
The creator is not responsible for any trading losses incurred while using this indicator. Use at your own risk.
---
🚀 START TRADING SMARTER TODAY
Add "Auto Option Chain" to your charts and experience the difference professional-grade option data makes to your trading decisions!
Happy Trading! 📊💰

Linear Regression Channel with Crossover SignalsLinear Regression Channel with Crossover Signals is an overlay indicator that plots a statistically derived **linear regression channel** around price and optionally generates **crossover / re-entry signals**, labels, alerts, and a small on-chart dashboard. It is designed to help visualize trend direction (via regression slope), typical price “containment” (via deviation bands), and potential breakout/mean-reversion events when price interacts with the channel.
---
## What this indicator shows
### 1) Linear Regression Midline (trend estimate)
The midline is the **linear regression value** of `close` over the selected *Regression Length*. It represents the “best fit” straight line through the last *N* bars, providing:
- **Trend direction** (via slope: rising/falling/flat)
- A dynamic reference level for midline cross signals (optional)
### 2) Upper / Lower Deviation Bands (channel)
A channel is built around the regression midline using the **standard deviation of price from the regression line**:
- Upper Band = midline + (stdDev × Deviation Multiplier)
- Lower Band = midline − (stdDev × Deviation Multiplier)
This creates a volatility-scaled envelope that adapts to how tightly or loosely price has been tracking the regression line.
### 3) Optional visual aids
You can independently toggle:
- Channel lines (upper/lower)
- Midline
- Channel fill (shaded area between bands)
- Background coloring to reflect whether price is **above / inside / below** the channel
A dashboard (optional) displays live values and context such as band values, distance from bands, current position, and trend direction.
---
## How it works (calculation overview)
### Regression calculation (manual)
The script calculates slope and intercept using a least-squares approach across the last `lengthInput` bars:
- It iterates over the window, builds sums (X, Y, XY, X²), and computes:
- **Slope** and **Intercept** of the regression line
- The midline value plotted is the regression value at the most recent point in the window.
### Standard deviation from the regression line
Instead of using standard deviation of closes directly, it measures the **deviation of each close from the regression line** and computes:
- variance = average of squared deviations
- stdDev = sqrt(variance)
This is what makes the channel represent “how far price typically strays from the trend line” over the lookback period.
---
## Signal logic (what triggers markers)
All signals are optional and controlled by the **Signal Types** toggles.
### A) Upper band cross signals (optional)
- **Upper Breakout (OB)**: price crosses **above** the Upper Band (`crossover(close, upperBand)`)
- **Upper Re-entry**: price crosses **back below** the Upper Band (`crossunder(close, upperBand)`)
These are often interpreted as “extension above channel” and “return from extension,” but interpretation depends on your style (breakout vs mean reversion).
### B) Lower band cross signals (optional)
- **Lower Breakdown (OS)**: price crosses **below** the Lower Band (`crossunder(close, lowerBand)`)
- **Lower Re-entry**: price crosses **back above** the Lower Band (`crossover(close, lowerBand)`)
### C) Midline cross signals (optional)
- **Mid Bullish**: price crosses above the regression midline
- **Mid Bearish**: price crosses below the regression midline
### D) Re-entry-to-channel signals (enabled by default)
The script tracks whether price was previously:
- **above** the channel (close > upperBand)
- **below** the channel (close < lowerBand)
- **inside** the channel
It then triggers “re-entry” when price returns inside the channel:
- **Bullish Re-entry (Bounce Support)**: price was below and crosses back above the Lower Band
- **Bearish Re-entry (Rejection Resistance)**: price was above and crosses back below the Upper Band
These are intended to highlight potential mean-reversion acceptance back into the “normal” channel range.
---
## Plot markers and labels (what you’ll see)
If enabled, the indicator can plot:
- Triangles and circles for band/midline crosses (with short text such as **OB**, **OS**, ▲, ▼)
- Diamond markers for re-entry confirmations (✓ / ✗)
- Optional text labels describing the event (e.g., “OVERBOUGHT Breakout”, “REJECTION Resistance”, etc.)
Note: this script sets high label/line limits (`max_labels_count` / `max_lines_count`) to reduce the chance of hitting platform limits when many signals occur.
---
## Alerts (optional)
When “Enable Alerts” is ON, the script can fire alerts for:
- Upper breakout / upper re-entry
- Lower breakdown / lower re-entry
- Re-entry bounce / re-entry rejection
- Midline bullish / bearish cross
Alerts are triggered **once per bar** when conditions occur. They are informational and should be validated within your trading plan.
---
## Inputs (how to tune it)
### Channel Settings
- **Regression Length**: larger = smoother and slower to react; smaller = more responsive but noisier
- **Deviation Multiplier**: larger = wider channel (fewer band touches); smaller = tighter channel (more touches)
- **Extend Forward**: present as an input, but this version does not draw forward-projected lines; it primarily affects nothing visually unless you add line objects later
### Signal Settings / Types
- Enable only the signal types you actually use to keep charts clean.
- Re-entry signals are ON by default because they depend on context (previously outside → back inside), which many traders find more meaningful than a single cross alone.
### Visual Settings
- Show/hide channel, midline, fill, background coloring
- Customize colors for upper/lower/mid and fill for readability
---
## Limitations / notes (important for public descriptions)
- This is an **indicator**, not a strategy; it does not backtest performance.
- Linear regression channels are **context-dependent**: strong trends can “ride” a band, and ranging markets can produce frequent crosses.
- Signals are based on **price crossing computed bands** and do not predict direction by themselves.
- Standard deviation bands reflect past dispersion around the regression line; volatility regime shifts can change behavior quickly.
- Always apply risk management and confirm with additional context (structure, volume, higher timeframe bias, session conditions, etc.).

Beast Mode - Hull Suite ProBeast Mode – Hull Suite Pro is a trend-following overlay indicator built around a dual “Hull ribbon” concept: a fast ribbon for swing/entry timing and an optional slow ribbon for higher-timeframe style trend context. It aims to make trend direction, trend changes, and lower-quality (choppy/ranging) conditions easy to see directly on price.
---
Core concept (what it does)
1) Fast Signal Ribbon (primary direction + flips)
The indicator computes a fast Hull-style moving average using your selected Hull variation and length. It then plots two lines:
- Fast Main = current fast Hull value
- Fast Lag = prior-bar fast Hull value
The space between them is filled to form a ribbon. When Fast Main is above Fast Lag, the ribbon is considered bullish and plotted green. When Fast Main is below Fast Lag, it is considered bearish and plotted red. This creates a simple, visual “slope/continuation” read without needing extra panels.
2) Slow Trend Ribbon (optional trend filter / bias)
A second, slower Hull-style ribbon (default length is user-configurable) can be plotted as a trend context layer. Like the fast ribbon, it uses a main line and its prior-bar value to determine direction. When enabled, it provides a higher-level bias that can be used to filter signals from the fast ribbon.
3) Chop Filter (optional ranging-market filter)
The script includes an optional Choppiness Index filter. When enabled, it blocks buy/sell labels during choppy conditions where trend-following signals often degrade. “Choppy” is defined as Choppiness Index above the user threshold.
4) Visual helpers (optional)
- Candle coloring can be enabled to match the fast ribbon direction.
- A compact dashboard table can be shown on the chart to summarize the current fast trend, slow trend, and whether filters are enabled.
---
How it works (calculation overview)
Hull variations
The indicator lets you choose one of three smoothing/response styles for both the fast ribbon and the slow ribbon:
- Hma: Hull Moving Average
- Ehma: EMA-based Hull variant
- Thma: Triangular/WMA-based Hull variant
A “Length Multiplier” scales the fast length to quickly tune sensitivity without changing your base length.
Preset system
A preset selector automatically adjusts the fast length and Hull variation for common use-cases:
- Fast: shorter length, more responsive (more signals, more noise)
- Balanced: middle ground
- Trend: longer and smoother (fewer signals)
Selecting “Custom” uses your manual inputs.
Fast ribbon direction state
- fastUp is true when the fast Hull value is higher than its previous value (Fast Main > Fast Lag).
- Color and candle coloring (if enabled) follow this state.
Slow ribbon direction state
- slowUp is true when the slow Hull value is higher than its previous value (Trend Main > Trend Lag).
- The slow ribbon is optional and can be hidden.
Choppiness Index
When enabled, the script computes the Choppiness Index over the chosen length and flags the market as choppy if it exceeds the threshold. Signals can be blocked during these flagged periods.
---
Signals (how buy/sell labels are generated)
Buy label (raw):
A Buy is triggered when the fast ribbon flips from bearish to bullish (fastUp becomes true after being false on the prior bar).
Sell label (raw):
A Sell is triggered when the fast ribbon flips from bullish to bearish (fastUp becomes false after being true on the prior bar).
Optional filters:
- Trend Filter (optional):
- If enabled, Buy labels only appear when the slow ribbon is bullish (slowUp = true).
- Sell labels only appear when the slow ribbon is bearish (slowUp = false).
- Chop Filter (optional):
- If enabled, both Buy and Sell labels are suppressed when the market is flagged as choppy (Choppiness Index > threshold).
These filters are designed to reduce low-quality flips in sideways markets and align signals with the broader trend context when desired.
---
How to use it (practical guidance)
1) Trend direction / bias
- Use the fast ribbon color and slope as your near-term trend read.
- If enabled, use the slow ribbon as a higher-level bias filter (e.g., focus on longs when the slow ribbon is green).
2) Entries and timing
- Buy/Sell labels are based on fast ribbon flips. Many traders treat flips as potential momentum shifts rather than guaranteed reversals. Consider confirming with your own market context (structure, levels, volume, session, etc.).
3) Avoiding chop (optional)
- If you trade trend continuation, enabling the Chop Filter can help avoid frequent flips during consolidation.
- Lower chop thresholds are stricter (fewer signals). Higher thresholds allow more signals through.
4) Parameter tuning
- Faster settings will react earlier but can whipsaw.
- Smoother settings reduce noise but can lag.
- The Length Multiplier is a quick way to adjust sensitivity without redesigning the setup.
---
Visual settings
- Show Buy/Sell Labels: toggles label plotting.
- Color Candles: colors bars based on the fast ribbon direction.
- Line Thickness / Fill Transparency: adjust readability.
- Dashboard: shows a small table with current states and filter status. Position is user-selectable.
---
Limitations / notes
- This indicator is not a strategy and does not provide backtest performance results.
- Like all moving-average-based tools, it is lagging by nature and can produce false flips in ranging conditions.
- The Chop Filter helps reduce ranging-market noise but will also filter out some early trend transitions.
- Signals are conditional visual markers and should be used with risk management and confirmation rules appropriate to your trading plan.

EAB: Distance (%) to EMAs/MAsRPL: Distance (%) to EMAs/MAs displays a compact table showing the percentage distance between the current price and selected moving averages, helping to quickly assess price extension relative to key technical references.
Features
• Distance to EMA 10, EMA 20, MA 50 and MA 200 (individually toggleable).
• Up to two custom moving averages , with selectable EMA or MA type and configurable period.
• Customizable colors, opacity, text size and vertical offset to fit the table cleanly on the chart.
How to use
1. Enable or disable moving averages from the “Show” section.
2. To add another average, enable “Custom Moving Average 1/2” and define its type and period.
3. Adjust the visual style from the “Table” section (colors, opacity, size and position).
Notes
• Distance is calculated as: (Close − Moving Average) / Moving Average × 100 .
• Informational indicator only; no entry or exit signals are provided .

Beast Mode - ORB Indicator [Advanced Retest & Targets]Beast Mode - ORB Indicator
The Beast Mode - ORB Indicator is a comprehensive institutional trading system designed to automate the Opening Range Breakout (ORB) strategy. Unlike standard ORB indicators that simply draw high/low lines, this script integrates "Smart Retest" logic, dynamic risk/reward targets, and volume/volatility filters to help traders identify high-probability setups while filtering out chop and fake-outs.
This tool is designed for Futures (ES, NQ, YM) and Equities traders who rely on the initial market balance to determine the day's directional bias.
How It Works
The Opening Range is defined as the High and Low price established during the first X minutes of the market session (e.g., 5 minutes, 15 minutes). This range represents the initial battle between buyers and sellers.
1. The Range Formation: The script monitors the user-defined opening window (e.g., 9:30–9:35 AM ET). Once the window closes, it plots the ORB High (Green), ORB Low (Red), and Midline (Gray).
2. The Breakout: A signal is generated when a candle closes outside the defined range. This signal is filtered by volume (must be higher than average) and range quality (to avoid trading during extremely tight or over-extended ranges).
3. The Smart Retest (New Feature): Breakouts often fail. The most reliable entry is often the retest of the breakout level. This script uses a unique algorithm to detect valid retests:
- Tolerance: Price must return to within a specific point range of the ORB level.
- Rejection: Price must physically "bounce" away from the level by a minimum point value.
- Volume: The rejection candle must have significant volume to confirm institutional defense of the level.
Key Features
1. Dynamic Risk/Reward Targets
The indicator automatically projects profit targets based on the size of the Opening Range:
- Target 1 (💰): Placed at a 1:1 ratio relative to the range size. (e.g., If the range is 20 points, T1 is 20 points above the High).
- Target 2: A user-defined multiplier (default 2.0x) for extended trend days.
- Stop Loss Zones: Visual dotted lines indicating statistically significant stop-loss placement levels.
2. Smart Retest Logic
Instead of blindly buying a touch of the line, the script waits for confirmation. It looks for a "Checkmark" pattern: Breakout -> Pullback to Zone -> Rejection Bounce. Retest signals are marked with a distinct "RE" label.
3. Quality Filters
- Volume Filter: Ensures that breakout signals are backed by relative volume (RVOL) to avoid "low volume drift" fake-outs.
- Range Filter: Prevents signals if the Opening Range is too small (chop) or too large (exhaustion), based on point values.
4. Professional Dashboard
A data table displays real-time statistics:
- Status: Forming, Active, or Waiting.
- Range: The exact size of the opening range in points.
- Position: Current price relation to the ORB (Above/Below/Inside).
- Targets: Exact price levels for T1 and T2.
Settings & Configuration
- ORB Timeframe: Select between 5m PreMarket, 5m Standard, 15m, or 30m ranges.
- Trading Session: Define your active trading hours (signals are muted outside this window).
- Target Multiplier: Adjust the extension for the second target (e.g., 1.5x, 2.0x, 3.0x).
- Retest Specifics:
- Tolerance: How close price must get to the line to count as a test.
- Min Bounce: How hard price must reject to trigger a signal.
- Visuals: Fully customizable colors for lines, backgrounds, and labels.
Disclaimer
This indicator is a technical analysis tool intended to assist in identifying market structure and potential areas of interest. Past performance of the Opening Range Breakout strategy does not guarantee future results. Users should always manage risk appropriately and use this tool in conjunction with their own analysis.
Concepts based on standard institutional Opening Range Breakout theory.

Auto Option Screener Pro Multi-Symbol Technical Dashboard# **Auto Option Screener Pro – Multi-Symbol Technical Dashboard**
**Real-time options screening with 15+ indicators, custom filters, and institutional-grade analytics**
***
## 📊 **What This Indicator Does**
**Auto Option Screener Pro** is a comprehensive **multi-symbol technical analysis dashboard** designed specifically for **NSE options traders**. It simultaneously monitors **30 symbols** (calls/puts) and displays real-time data for **15+ professional indicators** in a sortable, filterable table format.
Instead of flipping between charts, you get **instant visibility** across your entire watchlist: momentum, trend strength, volatility, volume analysis, and gap detection—all in one screen.
***
## 🎯 **Key Features**
### **Multi-Symbol Monitoring**
- Track **30 symbols simultaneously** (calls + puts)
- Toggle symbols on/off with checkboxes
- Optimized for **NSE options** (but works with any symbol)
- Lightweight code using matrix operations for speed
### **15+ Built-In Indicators**
- **RSI** (Relative Strength Index) – Overbought/oversold detection
- **TSI** (True Strength Index) – Double-smoothed momentum
- **ADX** (Average Directional Index) – Trend strength measurement
- **SuperTrend** – Trend-following with ATR-based stops
- **MACD** – Crossover and momentum signals
- **CMF** (Chaikin Money Flow) – Institutional money flow tracker
- **OBV** (On-Balance Volume) – Volume-price relationship
- **BB Power** (Bull/Bear Power) – Elder Ray indicator
- **Choppiness Index** – Trend vs. chop detection
- **∆VWAP** – Deviation from VWAP (value/trading)
- **Relative Volume** – Surge detection vs. average
- **RDX Score** – Custom ADX+RSI combo score (-5 to +5)
- **ATR Volatility** – Volatility ranking (Low/Medium/High)
- **Gap Detection** – Gap Up/Down with percentage
- **Price Change** – Real-time premium movement
### **Smart Filtering System**
- Filter any column by **custom range** (e.g., RSI 30-70, ADX > 25)
- **Column-specific thresholds** for each indicator
- **Toggle filters on/off** with one click
- Example: Show only options where RSI < 35 AND ADX > 30
### **Visual Intelligence**
- **Color-coded cells**: Green (bullish), Red (bearish), Gray (neutral)
- **ATR Volatility labels**: Lo/Md/Hi with color coding
- **Gap detection**: UP/DN/NO with directional colors
- **RDX Score**: -5 to +5 visual scoring system
- **Compact dashboard**: 18 columns × 40 rows maximum
### **Customizable Dashboard**
- **9 position options**: Top/Bottom/Middle + Left/Center/Right
- **Adjustable font sizes**: Small, Normal, Large, Huge
- **Theme-aware**: Works on dark/light TradingView themes
- **Auto-clearing**: Refreshes every bar for accuracy
---
## ⚙️ **How to Set Up**
### **Step 1: Add Your Symbols**
1. Click **Settings** (gear icon) on the indicator
2. Scroll to **Symbols** section
3. **Enable/disable symbols** using checkboxes (u01-u30)
4. **Replace default symbols** with your preferred options:
- Format: `NSE:SYMBOLYYMMDDCPRICE`
- Example: `NSE:NIFTY251230C25900`
### **Step 2: Configure Filters (Optional)**
1. Go to **Filter** section
2. **Enable filter** by checking "Filter" box
3. Select **Column** to filter (Price, RSI, TSI, ADX, SuperTrend, etc.)
4. Set **From** and **To** values
5. Only symbols meeting criteria will display
### **Step 3: Adjust Indicator Settings**
- **RSI Length**: Default 14 (overbought 65, oversold 35)
- **TSI Lengths**: Long 25, Short 13 (thresholds ±25)
- **ADX Smoothing**: Default 14 (threshold 30)
- **SuperTrend**: ATR 10, Factor 3.0
- **CMF**: Length 20 (thresholds ±0.3)
- **Choppiness**: Period 14 (trending <38.2, choppy >61.8)
- **RDX ADX**: Length 14, Threshold 14
- **ATR Volatility**: Period 14 (High >1.5%, Medium >1.0%)
### **Step 4: Position Dashboard**
- Choose **Dashboard Position** from dropdown
- Recommended: **Top right** or **Top left** for minimal chart overlap
- Adjust **font size** for readability
### **Step 5: Set Alerts (Optional)**
- Create alerts for individual symbols
- Use **combined conditions** from the dashboard
- Example: Alert when RDX Score = 5 AND ADX > 30
***
## 📈 **Indicator Guide**
### **Column Explanations**
| Column | What It Shows | How to Read |
|--------|---------------|-------------|
| **NnSexOpt** | Symbol name | Gray background |
| **Price** | Current premium | Always shown |
| **RSI** | Momentum (0-100) | >65 green (OB), <35 red (OS) |
| **TSI** | True strength | >25 red (OB), <-25 green (OS) |
| **ADX** | Trend strength | >30 green (strong trend) |
| **Sptrd** | SuperTrend | "Up" green, "Down" red |
| **MACD** | MACD trend | 1=uptrend green, -1=downtrend red |
| **CMF** | Money flow | >0.3 green, <-0.3 red |
| **OBV** | On-Balance Volume (Cr) | Positive/negative flow |
| **OHL** | Open=High/Low | "OH" red (bearish), "OL" green (bullish) |
| **BB+** | Bull Power | Positive green, negative red |
| **Chop** | Choppiness Index | <38.2 green (trending), >61.8 red (chop) |
| **∆VWAP** | VWAP deviation | Above green, below red |
| **RVol** | Relative volume | >1.5 green (surge) |
| **RDX** | ADX+RSI score | -5 to +5, color-coded |
| **ATR%** | Volatility % | Actual percentage value |
| **Vol** | Volatility label | Lo/Md/Hi with color |
| **Gap** | Gap type/size | UP/DN green/red + % |
***
## 🎨 **Color Coding**
- **Green Cells**: Bullish signals (overbought, uptrend, positive flow)
- **Red Cells**: Bearish signals (oversold, downtrend, negative flow)
- **Gray Cells**: Neutral or no signal
- **White Text**: All values for readability
- **Gray Header**: Row separators for scannability
---
## 🔧 **Advanced Usage Tips**
### **Finding High-Probability Setups**
1. **Bullish Combo**: RDX > 0 + ADX > 30 + ∆VWAP > 0 + CMF > 0.3
2. **Bearish Combo**: RDX < 0 + ADX > 30 + ∆VWAP < 0 + CMF < -0.3
3. **Momentum Surge**: RSI crossing 50 + RVol > 1.5 + ATR Volatility = Hi
4. **Trend Confirmation**: ADX > 30 + Chop < 38.2 + SuperTrend = Up
### **Avoiding False Signals**
- **Choppy Markets**: Skip when Chop > 61.8
- **Low Volume**: Ignore if RVol < 1.0
- **Weak Trend**: ADX < 20 = no trend, avoid directional trades
### **Options-Specific Strategies**
- **Premium Buyers**: Look for low RVol + RDX turning positive
- **Premium Sellers**: Target high RVol + Chop > 61.8 (rangebound)
- **Expiry Day**: Focus on Gap column + ∆VWAP for mean reversion
---
## ⚡ **Performance Notes**
- **Optimized for 30 symbols**: Uses matrix operations for speed
- **Updates on bar close**: Minimal repainting
- **Works on any timeframe**: 1m to 1D
- **NSE options tested**: Compatible with Indian options format
- **RAM usage**: ~50MB for 30 symbols on 1m chart
---
## 🎯 **Supported Instruments**
**Primary Use Case:**
- **NSE Options**: NIFTY, BANKNIFTY, FINNIFTY, MIDCPNIFTY, stock options
**Also Works With:**
- **Equity cash**: NSE, BSE stocks
- **Futures**: NIFTY, BANKNIFTY futures
- **Global instruments**: Any TradingView-supported symbol
***
## ⚠️ **Disclaimer & Risk Warning**
**IMPORTANT**: This indicator is for **educational and informational purposes only**.
- Options trading involves **substantial risk of loss**
- Past performance does not guarantee future results
- **Test thoroughly** on paper trading before live use
- Verify **liquidity and spreads** before trading
- **No signals are guaranteed**—use with proper risk management
- Creator is **not responsible** for any trading losses
**Always consult a financial advisor** before making trading decisions.
***
## 📝 **Version History**
**v1.0 (Current)**
- Initial release
- 30-symbol multi-screener
- 15+ indicators integration
- Custom filter system
- Gap detection
- ATR volatility labeling
- RDX scoring system
***
## 💬 **Feedback & Support**
Found this screener helpful? Please:
- ⭐ **Leave a rating** on TradingView
- 💬 **Share your strategies** in comments
- 📊 **Post chart ideas** using this indicator
- 🔔 **Follow for updates**
**Questions?** Drop a comment below—I'll help you optimize your settings!
***
**Tags**: Options Screener, NSE Options, Multi-Symbol, Technical Analysis, RSI, ADX, SuperTrend, MACD, CMF, VWAP, Volatility, Gap Detection, RDX Score, Intraday Trading, Options Trading
***
**Legal**: This tool does not constitute financial advice. All trading decisions are your responsibility. Always use risk capital you can afford to lose.

Low-High Waves for NeowaveOpen your chart at daily and hide the symbol graphic. Now you can see the waves. It’s including limited data sorry for this but I’m not a programmer and TradingView have limitations.

Gamma Conviction OscillatorGamma Conviction Oscillator
OVERVIEW
The Gamma Conviction Oscillator is a specialized momentum study that integrates volume-weighted price change with a dynamic volatility-adjustment engine. Unlike traditional oscillators, it scales its sensitivity based on current market ATR, allowing the tool to stay responsive during low-volatility drifts and stabilize during high-volatility expansions.
THE MATH BEHIND THE "CONVICTION"
Volatility-Adjusted Sensitivity: The script utilizes a normalized ATR ratio to calculate a 'Dynamic Adjustment Factor.' This ensures that overbought/oversold thresholds are not static but react to the current market regime.
Volume-Weighted Basis: Momentum is calculated using the product of price-change and volume, ensuring that "Conviction" is only displayed when there is actual participation behind the move.
Trend-Alignment Filter: The coloring engine uses a long-term moving average anchor to determine the 'Context.' Conviction is categorized as 'Trend-Aligned' or 'Counter-Trend' based on the price relation to this long-term anchor.
HOW TO USE
Observe the Oscillator Color:
Bright Lime / Bright Red: High-momentum extremes aligned with the long-term trend. Indicates areas where price movement has strong participation and trend confirmation.
Teal / Maroon: Counter-trend momentum extremes, highlighting potential areas for trend testing or mean-reversion.
Assess Overbought and Oversold Zones:
The dynamic overbought (OB) and oversold (OS) levels adjust based on current market volatility. Readings outside these zones indicate stronger-than-normal conviction.
Consider Trend Context:
Compare the oscillator reading to the long-term trend (based on the selected moving average). Alignment with the trend reinforces trend strength; divergence may indicate temporary pullbacks or consolidation.
Adjust Inputs for Your Trading Timeframe:
Base Oscillator Length: Shorter values make the oscillator more responsive to intraday momentum; longer values smooth for swing analysis.
Volatility Smoothing Length: Controls sensitivity to ATR fluctuations; higher values reduce noise in volatile markets.
Dynamic Sensitivity Factor: Fine-tunes how strongly volatility influences the oscillator scale.
Use as an Educational Guide:
This tool is a visualization of historical and current momentum. Use it to study how momentum builds, fades, or reverses. It does not generate trade signals and is for educational and informational purposes only.
NOTES
All calculations are proprietary and protected to preserve the underlying logic. This script is intended purely as an educational visualization tool.

MacroTide Elasticity SystemThe MacroTide Elasticity System is a professional-grade technical analysis tool designed to identify potential trend exhaustions and reversals by modeling price action as an elastic band stretched from a volume-weighted baseline. Unlike standard oscillators (like RSI) that only look at price changes, MacroTide integrates Volume, Price Range, and Volatility to gauge the "energy" behind a move.
1. Concepts and Methodology
The core concept is Mean Reversion based on Volume-Weighted Elasticity. Markets tend to snap back to a value consensus (mean) after over-extension.
Volume-Weighted Baseline: We use a Volume Weighted Moving Average (VWMA) rather than a simple SMA. This ensures that heavy-volume trading days pull the baseline closer to price, while low-volume drift allows the baseline to lag, accurately representing the "true" average cost.
Elasticity Physics: The oscillator calculates how far price has deviated from this VWMA baseline, measured in standard deviations. This creates a normalized "Elasticity Score" (0-100).
High Score (>80): Price is over-extended to the upside (Overbought) relative to volume support.
Low Score (<20): Price is over-extended to the downside (Oversold).
Institutional Absorption (Churn): The script detects specific bar anomalies where Volume is High but Price Range is Low. This pattern often indicates "Churn"—where institutions are absorbing supply or unloading positions without moving the price significantly.
2. Key Features
MacroTrend Detection: Visualizes the market's stretch limits.
Divergence Scanner: Automatically detects and labels Regular Bullish and Bearish divergences. This occurs when price makes a new extreme, but the Elasticity Oscillator fails to confirm it, signaling waning momentum.
Absorption Events: Highlights yellow "sun" markers on the oscillator when high-volume churn is detected, often preceding a breakout or reversal.
Dynamic Coloring: Candles and oscillator lines change color based on the slope of the elasticity (Green for rising momentum, Red for falling).
3. How to Use
Trend Reversals: Look for the oscillator to enter the Overbought (80) or Oversold (20) zones. A reversal signal (triangle marker) is generated when the oscillator crosses back out of these zones, indicating the "snap back" effect has begun.
Divergence Confirmation: Use the "DIV" labels as early warning signs. A Bullish Divergence in an oversold zone is a high-probability setup for a long entry.
Filtering Trends: The center line (50) acts as a trend filter. Above 50 indicates bullish bias; below 50 indicates bearish bias.
4. Settings & Customisation
Lookback Period: Default is 21 (Swing). Increase to 50 or 100 for Macro/Long-term analysis.
StdDev Multiplier: Adjusts the sensitivity of the bands. Higher values (e.g., 2.5 or 3.0) are better for volatile assets like Crypto.
Absorption Volume Factor: Threshold for detecting churn. Default is 1.5x average volume.
Disclaimer: This tool is for informational purposes only. Past performance (divergences/signals) does not guarantee future results. Always manage risk effectively.

GardFx - Fusion Pro FREE TrialFusion Pro - by GardFx
This script is a specialized session-trading system designed to capitalize on the Opening Range Breakout (ORB) by utilizing Fair Value Gaps (FVG) as entry confirmation zones. Unlike standard breakout indicators that signal immediately upon a range break, this system waits for a price retest (mitigation) of specific imbalances created during the breakout move.
Core Concept
The strategy operates on a three-step logic sequence:
Define the Range: It establishes the High and Low of the opening session (London or New York).
Identify Imbalance: Upon a breakout of this range, the script scans for the creation of a Fair Value Gap (FVG) on the 1-minute timeframe.
Confirm Entry: It waits for price to retrace into the FVG (mitigation) and looks for specific candle confirmation patterns before generating a signal.
Detailed Methodology
1. The Opening Range (ORB)
The script monitors the first 15 minutes of the session (configurable).
High Line: The highest price reached during the first 15m.
Low Line: The lowest price reached during the first 15m.
Breakout: A breakout is validated when a candle closes outside of this defined range.
2. Fair Value Gap (FVG) Detection
Shutterstock
Not all breakouts are valid. This script filters for momentum by requiring an FVG to form immediately following the breakout.
Bullish FVG: Defined when the Low of Candle 1 is higher than the High of Candle 3.
Bearish FVG: Defined when the High of Candle 1 is lower than the Low of Candle 3.
Note: If an FVG is not formed shortly after the breakout, the setup is considered low-probability and ignored.
3. Entry Confirmation Models Once an FVG is identified and price returns to mitigate it, the script offers three confirmation modes:
Instant (First Touch): Aggressive entry immediately when price touches the FVG box.
Reversal Close: Waits for a candle to close in the direction of the trend after touching the FVG (e.g., a green candle close after dipping into a bullish FVG).
Engulfing Candle: The most conservative filter. Requires a full engulfing candle pattern occurring within or bouncing off the FVG.
4. Advanced Filters To reduce false signals during choppy markets, two optional filters are included:
Volume Filter: Requires the breakout candle's volume to be higher than its Moving Average (multiplied by a user-defined factor).
Higher Timeframe (HTF) Trend: Checks the trend on a higher timeframe (e.g., 1H or 4H).
Logic: If the HTF Close is > HTF EMA 50, only Buy signals are permitted. If HTF Close < HTF EMA 50, only Sell signals are permitted.
5. Risk Management The script includes an automated Risk/Reward calculator.
Stop Loss (SL): Placed at the invalidation point of the FVG structure, plus an optional ATR buffer to account for volatility.
Take Profit (TP): Calculated based on a user-defined Risk:Reward ratio (e.g., 1:2) relative to the Stop Loss distance.
Dashboard A multi-timeframe dashboard is displayed to provide a "Glance View" of market bias across the Daily, 4H, 1H, and 15M timeframes, ensuring trades are aligned with macro momentum.
3 hours ago
Release Notes
🚀 GardFx - Fusion Pro V2: The Ultimate ORB & ICT Suite
Welcome to Version 2.0 of Fusion Pro. This update transforms the indicator from a simple breakout tool into a complete institutional trading system. We have integrated Multi-Timeframe (MTF) logic, Candlestick Pattern recognition, and Smart Exit management to filter out noise and catch high-probability moves.
🔥 NEW FEATURES IN V2:
1. 🧠 Smart MTF Bias & Voting System
No more guessing the trend. The script now checks Daily, 4H, 1H, and 15m timeframes.
Voting Logic: A trade is only signaled if the higher timeframes agree (e.g., 2 out of 3 votes).
Visuals: The dashboard displays the live bias for every timeframe.
2. 🎯 Advanced Entry Confirmations We have added specific trigger patterns to reduce fake-outs. You can now choose your entry style:
🦄 Unicorn Setup: ORB Level + FVG overlap.
🕯️ Candlestick Patterns: Pinbar, Engulfing, Tweezer Tops/Bottoms, and Inside Bar.
📉 FVG 50%: Wait for price to retrace to the 50% equilibrium of the gap before entering.
3. 🛡️ Entry Validation Modes Control exactly when the entry label fires:
Instant: Enters immediately upon touch.
Candle Close: Waits for the candle to close in your direction.
Break of High/Low: Places a pending order at the wick; only enters if momentum breaks that level.
Wait for MSS: Waits for a Market Structure Shift (local high/low break).
4. 💰 Dynamic Smart Exit (Secure TP)
A new Volume-Based Exit Manager detects sudden momentum shifts or volume spikes against your position.
It prints a "Secure TP" label to help you bank profits before a reversal occurs, even if the fixed TP hasn't been hit.
5. 📊 Enhanced Dashboard & Stats
Tracks Win/Loss rates separately for Asia, London, and New York sessions.
Weekly and Daily stats reset automatically.
Fully customizable size and position.
6. ⚡ Automated UK Sessions
Built-in timings for Asia, London, and New York based on UTC (London) time. No more timezone conversion headaches.

Bullish/Bearish Movement SumThis indicator calculates and displays the cumulative sum of bullish and bearish price movements over a specified period.
Features:
- Green line: Cumulative sum of all bullish movements
- Red line: Cumulative sum of all bearish movements (absolute value)
- Blue area: Net difference (bullish - bearish)
- Information table showing current values and bull/bear ratio
Settings:
- Calculation Period: Choose rolling window size (default: 100 bars) or 0 for cumulative from start
- Calculation Mode: Choose between "Points" (absolute price changes) or "Percentage" (% changes)
Use Cases:
- Identify market directional strength
- Compare bullish vs bearish pressure
- Spot divergences between price and directional momentum
- Ratio > 1 indicates more bullish than bearish movement
Developed with assistance from Claude (Anthropic)

Rainbow Road [kingthies]Rainbow Road
Rainbow Road is a trend-structure and momentum visualization tool built around a cascading chain of smoothed simple moving averages. Instead of plotting independent moving averages on price, each line is progressively smoothed from the prior one using the same length, creating a layered “road” that reveals trend strength, direction, and transition with exceptional clarity.
OVERVIEW
Rainbow Road visualizes trend quality using a spectrum of fast-to-slow moving averages derived from one another. Because each average is smoothed from the prior line, the indicator forms a continuous structure rather than a collection of unrelated signals. This makes trend alignment, momentum expansion, and compression immediately visible.
HOW IT WORKS
The first average is a Simple Moving Average of price
Each subsequent average is an SMA of the previous average using the same length
This creates a cascading chain of averages with increasing smoothness
Colors progress from red (fastest) to purple (slowest) to represent trend hierarchy
HOW TO READ IT
Strong Trend : All averages are aligned and expanding in the same direction
Acceleration : Spacing between averages increases
Deceleration : Spacing narrows while direction remains intact
Consolidation : Averages converge and overlap
Reversal Risk : Faster averages cross back through the slowest average
TREND CONTEXT
The optional fill between the fastest and slowest averages visualizes overall trend pressure. Expanding fill suggests strengthening momentum, while contracting fill highlights compression and potential regime change.
USE CASES
Trend confirmation and directional bias
Momentum expansion vs compression analysis
Identifying trend exhaustion and early reversal zones
Contextual filtering for entries and exits
WHY RAINBOW ROAD
Traditional moving average stacks often produce clutter and redundant signals. Rainbow Road focuses on structure and flow, helping traders evaluate the quality of a trend rather than reacting to individual crossovers.
BEST USED WITH
Price action and market structure
Support and resistance
Volatility or range-based tools
Higher-timeframe trend bias
Rainbow Road is designed to sit quietly on your chart and clearly communicate whether the market is flowing, stalling, or preparing to turn.

Smart Money Concept Change of Character Break of StructureSMC Structure
Visualizes Change of Character (CHoCH) and Break of Structure (BoS) - two fundamental Smart Money Concepts for identifying trend reversals and continuations.
This is the 1st version of an implementation of this concept.
It is NOT supposed to be used as a signal but a confirmation. Best use during NYSE hours.
Full Description
Overview
This indicator automatically detects and displays two core Smart Money Concepts (SMC) directly on your chart:
CHoCH (Change of Character) – The first structural break against the prevailing trend, signaling a potential reversal
BoS (Break of Structure) – A structural break in the direction of the current trend, confirming continuation
These concepts are essential building blocks of SMC trading methodology, helping traders identify where institutional players may be entering or exiting positions.
How It Works
The indicator uses pivot-based swing detection to identify significant highs and lows. When price breaks through these levels, it classifies the move as either a CHoCH or BoS based on the current trend context.
CHoCH (Change of Character)
Occurs when price breaks structure AGAINST the current trend
First warning sign that the trend may be reversing
Displayed as a solid horizontal line with "CHoCH" label
Green = Bullish reversal | Red = Bearish reversal
BoS (Break of Structure)
Occurs when price breaks structure IN THE DIRECTION of the current trend
Confirms that the existing trend remains intact
Displayed as a dashed horizontal line with "BoS" label
Teal = Bullish continuation | Maroon = Bearish continuation
Visual Example
Uptrend with BoS (continuation):
HH ◄── BoS (trend continues)
/
HL
/
HH
/
HL
Uptrend → CHoCH → Downtrend (reversal):
HH
/ \
HL \
LL ◄── CHoCH (trend reversal!)
Settings
Pivot Settings
Pivot Lookback: Number of bars used to identify swing highs/lows (default: 5). Higher values = fewer but more significant structure points.
Display Options
Show CHoCH: Toggle CHoCH visualization
Show BoS: Toggle BoS visualization
Show Swing Points: Display SH/SL labels at detected pivots
Extend Lines to Right: Extend structure lines into future bars
Show Info Table: Display current trend and last swing levels
Show Trend Background: Color the chart background based on trend direction
Colors
Fully customizable colors for all elements
How to Use
Identify the trend: Look at the sequence of CHoCH and BoS signals to understand market structure
Watch for CHoCH: A CHoCH signals potential reversal – wait for confirmation before trading against the previous trend
Trade with BoS: BoS confirms trend continuation – look for entries on pullbacks in the direction of the trend
Combine with other SMC concepts: Works great alongside Order Blocks, Fair Value Gaps, and liquidity concepts
Tips
Use higher pivot lookback values on higher timeframes for cleaner signals
A CHoCH doesn't guarantee reversal – it's the first warning sign, not confirmation
Multiple BoS signals in a row indicate a strong, healthy trend
Look for CHoCH occurring at key levels (support/resistance, order blocks) for higher probability setups
Feedback Welcome!
This is an open-source indicator and I'd love to hear your thoughts!
Please comment below if you have:
Feature requests or ideas for improvements
Bug reports or issues
Suggestions for additional SMC concepts to add
Your feedback helps make this indicator better for everyone. Happy trading! 🚀
