Gott's Copernican Trend PredictorThe Gott's Copernican Trend Predictor predicts trend duration using the Copernican Principle - Based on astrophysicist Richard Gott's temporal prediction method.
I had the idea to create this indicator after reading the book The Doomsday Calculation by William Poundstone.
Background & Theory
This indicator implements J. Richard Gott III's Copernican Principle - a statistical method that famously predicted the fall of the Berlin Wall and the duration of Broadway shows with remarkable accuracy.
The Copernican Principle Explained
Named after Copernicus who showed that Earth is not at the center of the universe, this principle assumes that you are not observing something at a special moment in time. When you observe a trend at any random point, you're statistically more likely to be seeing it during the "middle portion" of its lifetime rather than at its very beginning or end.
The Mathematics
Gott's formula provides a 95% confidence interval for how much longer a trend will continue:
Minimum remaining duration = Current Age ÷ 39
Maximum remaining duration = Current Age × 39
The factor of 39 comes from statistical analysis where:
There's only a 2.5% chance you're observing in the first 1/40th of the trend's life
There's only a 2.5% chance you're observing in the last 1/40th of the trend's life
This gives us 95% confidence that the trend will last between Age/39 and Age×39
How It Works
Trend Detection
The indicator uses dual moving averages (default: 50 & 200 period) to identify trend changes:
Bullish Cross: Fast MA crosses above Slow MA → Uptrend begins
Bearish Cross: Fast MA crosses below Slow MA → Downtrend begins
Real-Time Predictions
Once a trend is detected, the indicator continuously calculates:
Trend Age: How long the current trend has been active
Gott's 95% CI: Statistical range for remaining trend duration
Projected End Dates: Calendar dates when the trend might end
How to Use
Setup
Add the indicator to any timeframe (works on minutes, hours, days, weeks)
Customize MA periods and type (SMA, EMA, WMA)
Choose table position and font size for optimal viewing
Interpretation
Example: If a trend is 100 hours old:
Minimum duration: 100 ÷ 39 = ~3 more hours
Maximum duration: 100 × 39 = ~3,900 more hours
95% confidence: The trend will end between these times
This indicator might be useful for swing traders, trend followers, and quantitative analysts.
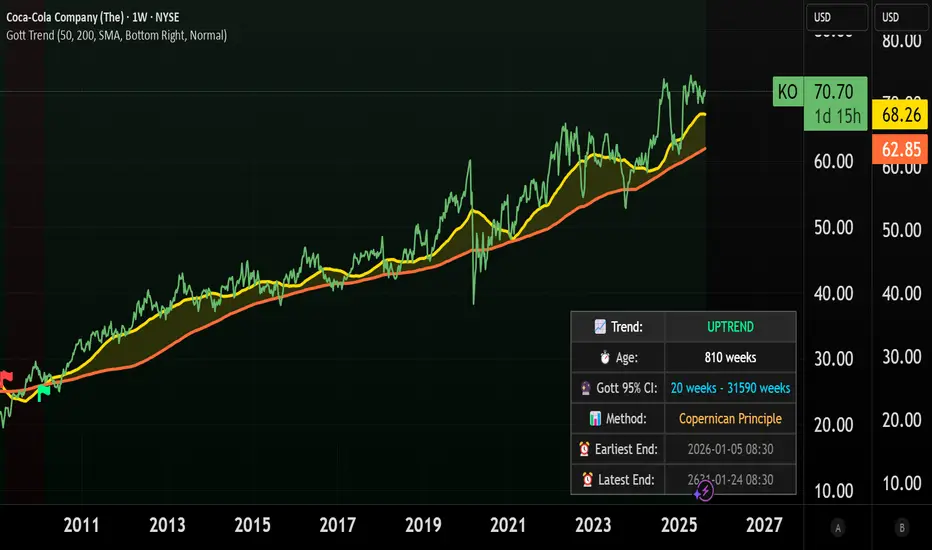
Coca-Cola example:
Coca-Cola's chart shows an uptrend spanning 810 weeks, approximately 15.5 years. According to Gott's Copernican Principle, this trend age generates a 95% confidence interval predicting the trend will continue for a minimum of 20 weeks and a maximum of 31,590 weeks.
On the other hand, a shorter trend age produces a proportionally smaller minimum duration and different risk profile in terms of statistical continuation probability. For this reason, more recent trends (and more recent companies) are likely to remain in trend for shorter.
Trenddetection
Hurst Exponent Adaptive Filter (HEAF) [PhenLabs]📊 PhenLabs - Hurst Exponent Adaptive Filter (HEAF)
Version: PineScript™ v6
📌 Description
The Hurst Exponent Adaptive Filter (HEAF) is an advanced Pine Script indicator designed to dynamically adjust moving average calculations based on real time market regimes detected through the Hurst Exponent. The intention behind the creation of this indicator was not a buy/sell indicator but rather a tool to help sharpen traders ability to distinguish regimes in the market mathematically rather than guessing. By analyzing price persistence, it identifies whether the market is trending, mean-reverting, or exhibiting random walk behavior, automatically adapting the MA length to provide more responsive alerts in volatile conditions and smoother outputs in stable ones. This helps traders avoid false signals in choppy markets and capitalize on strong trends, making it ideal for adaptive trading strategies across various timeframes and assets.
Unlike traditional moving averages, HEAF incorporates fractal dimension analysis via the Hurst Exponent to create a self-tuning filter that evolves with market conditions. Traders benefit from visual cues like color coded regimes, adaptive bands for volatility channels, and an information panel that suggests appropriate strategies, enhancing decision making without constant manual adjustments by the user.
🚀 Points of Innovation
Dynamic MA length adjustment using Hurst Exponent for regime-aware filtering, reducing lag in trends and noise in ranges.
Integrated market regime classification (trending, mean-reverting, random) with visual and alert-based notifications.
Customizable color themes and adaptive bands that incorporate ATR for volatility-adjusted channels.
Built-in information panel providing real-time strategy recommendations based on detected regimes.
Power sensitivity parameter to fine-tune adaptation aggressiveness, allowing personalization for different trading styles.
Support for multiple MA types (EMA, SMA, WMA) within an adaptive framework.
🔧 Core Components
Hurst Exponent Calculation: Computes the fractal dimension of price series over a user-defined lookback to detect market persistence or anti-persistence.
Adaptive Length Mechanism: Maps Hurst values to MA lengths between minimum and maximum bounds, using a power function for sensitivity control.
Moving Average Engine: Applies the chosen MA type (EMA, SMA, or WMA) to the adaptive length for the core filter line.
Adaptive Bands: Creates upper and lower channels using ATR multiplied by a band factor, scaled to the current adaptive length.
Regime Detection: Classifies market state with thresholds (e.g., >0.55 for trending) and triggers alerts on regime changes.
Visualization System: Includes gradient fills, regime-colored MA lines, and an info panel for at-a-glance insights.
🔥 Key Features
Regime-Adaptive Filtering: Automatically shortens MA in mean-reverting markets for quick responses and lengthens it in trends for smoother signals, helping traders stay aligned with market dynamics.
Custom Alerts: Notifies on regime shifts and band breakouts, enabling timely strategy adjustments like switching to trend-following in bullish regimes.
Visual Enhancements: Color-coded MA lines, gradient band fills, and an optional info panel that displays market state and trading tips, improving chart readability.
Flexible Settings: Adjustable lookback, min/max lengths, sensitivity power, MA type, and themes to suit various assets and timeframes.
Band Breakout Signals: Highlights potential overbought/oversold conditions via ATR-based channels, useful for entry/exit timing.
🎨 Visualization
Main Adaptive MA Line: Plotted with regime-based colors (e.g., green for trending) to visually indicate market state and filter position relative to price.
Adaptive Bands: Upper and lower lines with gradient fills between them, showing volatility channels that widen in random regimes and tighten in trends.
Price vs. MA Fills: Color-coded areas between price and MA (e.g., bullish green above MA in trending modes) for quick trend strength assessment.
Information Panel: Top-right table displaying current regime (e.g., "Trending Market") and strategy suggestions like "Follow trends" or "Trade ranges."
📖 Usage Guidelines
Core Settings
Hurst Lookback Period
Default: 100
Range: 20-500
Description: Sets the period for Hurst Exponent calculation; longer values provide more stable regime detection but may lag, while shorter ones are more responsive to recent changes.
Minimum MA Length
Default: 10
Range: 5-50
Description: Defines the shortest possible adaptive MA length, ideal for fast responses in mean-reverting conditions.
Maximum MA Length
Default: 200
Range: 50-500
Description: Sets the longest adaptive MA length for smoothing in strong trends; adjust based on asset volatility.
Sensitivity Power
Default: 2.0
Range: 1.0-5.0
Description: Controls how aggressively the length adapts to Hurst changes; higher values make it more sensitive to regime shifts.
MA Type
Default: EMA
Options: EMA, SMA, WMA
Description: Chooses the moving average calculation method; EMA is more responsive, while SMA/WMA offer different weighting.
🖼️ Visual Settings
Show Adaptive Bands
Default: True
Description: Toggles visibility of upper/lower bands for volatility channels.
Band Multiplier
Default: 1.5
Range: 0.5-3.0
Description: Scales band width using ATR; higher values create wider channels for conservative signals.
Show Information Panel
Default: True
Description: Displays regime info and strategy tips in a top-right panel.
MA Line Width
Default: 2
Range: 1-5
Description: Adjusts thickness of the main MA line for better visibility.
Color Theme
Default: Blue
Options: Blue, Classic, Dark Purple, Vibrant
Description: Selects color scheme for MA, bands, and fills to match user preferences.
🚨 Alert Settings
Enable Alerts
Default: True
Description: Activates notifications for regime changes and band breakouts.
✅ Best Use Cases
Trend-Following Strategies: In detected trending regimes, use the adaptive MA as a trailing stop or entry filter for momentum trades.
Range Trading: During mean-reverting periods, monitor band breakouts for buying dips or selling rallies within channels.
Risk Management in Random Markets: Reduce exposure when random walk is detected, using tight stops suggested in the info panel.
Multi-Timeframe Analysis: Apply on higher timeframes for regime confirmation, then drill down to lower ones for entries.
Volatility-Based Entries: Use upper/lower band crossovers as signals in adaptive channels for overbought/oversold trades.
⚠️ Limitations
Lagging in Transitions: Regime detection may delay during rapid market shifts, requiring confirmation from other tools.
Not a Standalone System: Best used in conjunction with other indicators; random regimes can lead to whipsaws if traded aggressively.
Parameter Sensitivity: Optimal settings vary by asset and timeframe, necessitating backtesting.
💡 What Makes This Unique
Hurst-Driven Adaptation: Unlike static MAs, it uses fractal analysis to self-tune, providing regime-specific filtering that's rare in standard indicators.
Integrated Strategy Guidance: The info panel offers actionable tips tied to regimes, bridging analysis and execution.
Multi-Regime Visualization: Combines adaptive bands, colored fills, and alerts in one tool for comprehensive market state awareness.
🔬 How It Works
Hurst Exponent Computation:
Calculates log returns over the lookback period to derive the rescaled range (R/S) ratio.
Normalizes to a 0-1 value, where >0.55 indicates trending, <0.45 mean-reverting, and in-between random.
Length Adaptation:
Maps normalized Hurst to an MA length via a power function, clamping between min and max.
Applies the selected MA type to close prices using this dynamic length.
Visualization and Signals:
Plots the MA with regime colors, adds ATR-based bands, and fills areas for trend strength.
Triggers alerts on regime changes or band crosses, with the info panel suggesting strategies like momentum riding in trends.
💡 Note:
For optimal results, backtest settings on your preferred assets and combine with volume or momentum indicators. Remember, no indicator guarantees profits—use with proper risk management. Access premium features and support at PhenLabs.

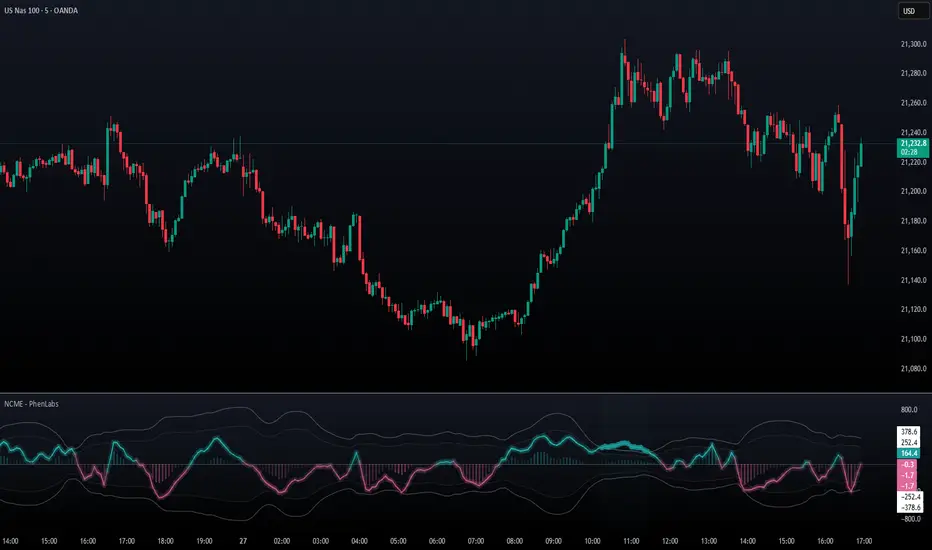
Navier-Cauchy Market Elasticity [PhenLabs]📊 Navier-Cauchy Market Elasticity
Version: PineScript™ v6
📌 Description
The Navier-Cauchy Market Elasticity (NCME) indicator takes a new step into technical analysis by applying materials science principles to financial markets. Similar to last weeks release utilizing Navier-Stokes dynamics equation this indicator focuses on the elastic interaction of virtual “solids”. Based on elasticity theory used in engineering, NCME treats price movements as material deformations, calculating market stress and strain using proven physics formulas. This unique approach reveals hidden market dynamics invisible to traditional indicators.
By implementing Lamé parameters and Young’s modulus calculations, NCME identifies critical stress points where markets exhibit extreme tension or compression. These zones often precede significant price movements, providing traders with advanced warning of potential reversals or breakouts.
🚀 Points of Innovation
• First indicator to apply Navier-Cauchy elasticity equations to market analysis
• Dynamic stress tensor calculations adapted for one-dimensional price movements
• Real-time Poisson ratio adjustments for market-specific elasticity modeling
• Gradient-based coloring system that visualizes stress intensity variations
• Advanced display modes with customizable visual layers for professional analysis
• Physics-based volatility normalization using Young’s modulus principles
🔧 Core Components
• Elasticity Engine: Calculates market elasticity using volatility-adjusted Young’s modulus
• Stress Tensor System: Computes normal stress values using Lamé parameters (λ and μ)
• Strain Measurement: Tracks price displacement relative to historical movement patterns
• Dynamic Bands: Statistical deviation bands that adapt to market elasticity changes
🔥 Key Features
• Four Display Modes: Choose between Histogram, Line, Both, or Advanced visualization
• Five Color Schemes: Modern, Classic, Neon, Ocean, and Fire themes with gradient support
• Background Stress Zones: Five distinct zones showing market stress levels visually
• Customizable Smoothing: Adjustable period for noise reduction without signal lag
• Extreme Value Detection: Automatic marking of critical stress points with visual alerts
• Advanced Mode Options: Glow effects, momentum ribbon, and extreme dots toggles
🎨 Visualization
• Stress Line: Primary indicator showing real-time market stress with gradient coloring
• Histogram Bars: Normalized stress values with dynamic opacity based on magnitude
• Reference Bands: Primary and secondary deviation bands for context
• Background Zones: Color-coded regions indicating stress intensity levels
• Signal Dots: Markers appearing at extreme stress points for easy identification
📖 Usage Guidelines
Display Settings
• Display Style
○ Default: Advanced
○ Options: Histogram, Line, Both, Advanced
○ Description: Controls visual presentation mode. Advanced offers the most comprehensive view with multiple layers
• Smoothing Period
○ Default: 3
○ Range: 1-50
○ Description: Moving average periods for noise reduction. Higher values create smoother signals but may introduce lag
Elasticity Parameters
• Displacement Length
○ Default: 14
○ Range: 1-100
○ Description: Lookback period for strain calculation. Shorter periods detect rapid stress changes
• Elasticity Length
○ Default: 30
○ Range: 1-200
○ Description: Period for volatility-based elasticity calculation. Longer periods provide more stable readings
• Poisson Ratio
○ Default: 0.3
○ Range: 0-0.5
○ Description: Theoretical elasticity ratio. 0.3 works well for most markets; adjust for specific asset classes
✅ Best Use Cases
• Identifying market tension before major breakouts
• Detecting compression zones during accumulation phases
• Confirming trend strength through stress persistence
• Timing reversals at extreme stress levels
• Multi-timeframe stress analysis for comprehensive market view
⚠️ Limitations
• Requires sufficient price history for accurate elasticity calculations
• May produce false signals during unprecedented market events
• Works best in liquid markets with consistent volume
• Not suitable as a standalone trading system
💡 What Makes This Unique
• Physics-Based Foundation: First indicator to properly implement elasticity theory
• Academic Rigor: Based on proven Navier-Cauchy equations from materials science
• Visual Innovation: Multiple display modes with professional-grade aesthetics
• Adaptive Technology: Self-adjusting parameters based on market conditions
🔬 How It Works
1. Strain Calculation:
• Measures price displacement over specified period
• Normalizes displacement relative to price level
2. Elasticity Determination:
• Calculates Young’s modulus using inverse volatility
• Updates Lamé parameters based on Poisson ratio
3. Stress Computation:
• Applies elasticity theory formula: σ = (λ + 2μ) × ε
• Scales result for visual clarity
• Applies smoothing to reduce noise
💡 Note: NCME represents a breakthrough in applying physics principles to market analysis. While based on proven scientific formulas, remember that markets are complex systems influenced by human psychology and external factors. Use NCME as part of a comprehensive trading strategy with proper risk management.
Impulse Volume Oscillator [Alpha Extract]Impulse Volume Oscillator
A sophisticated indicator designed to identify market impulse moves and volume-based momentum shifts, helping traders capture significant price movements with precision.
Combining price deviations with volume analysis, this oscillator dynamically measures market strength and weakness, providing clear signals for potential trend continuations and reversals.
🔶 Volume-Adjusted Normalization
Utilizes a unique normalization technique that incorporates volume impact to enhance signal quality. This approach ensures the indicator responds more strongly to high-volume price movements while filtering out low-volume noise.
vol_ratio = ta.rsi(volume, 14) / 50
vol_factor = vol_impact > 0 ? 1 + (vol_ratio - 1) * vol_impact : 1
raw_normalized = dev / (ta.stdev(source, bars) * mult)
vol_adjusted = raw_normalized * vol_factor
normalized = ta.sma(vol_adjusted, smooth)
🔶 Adaptive Regime Detection
Incorporates threshold-based regime identification that clearly distinguishes between trending and mean-reverting market conditions. The customizable threshold system allows traders to adapt to different market volatilities and timeframes.
🔶 Customizable Parameters
Fine-tune detection sensitivity with adjustable inputs for lookback period, standard deviation multiplier, volume impact, and signal smoothing. These parameters enable traders to optimize the indicator for various trading styles and market conditions.
❓How It Works
🔶 Impulse Calculation
The oscillator measures price deviation from a moving average baseline, normalized by standard deviation, and then adjusts the signal based on relative volume strength. This creates a responsive yet stable indicator that accurately reflects market momentum.
// Calculate the basis using the selected MA
basis = get_ma(source, bars)
// Calculate the normalized value with volume impact
dev = source - basis
🔶 Dynamic Visualization
The histogram changes color based on signal strength, providing instant visual cues about market conditions. Green bars indicate positive momentum while red bars represent negative momentum, with color intensity reflecting signal strength.
🔶 Trend Confirmation
Built-in trend direction analysis provides confluence with the primary signal, helping traders distinguish between counter-trend bounces and genuine trend reversals. This dual-confirmation approach significantly reduces false signals.
🔶 Visual Alerts & Boundary Tracking
Monitors signal extremes and dynamically adjusts visualization transparency based on signal strength. The indicator highlights particularly strong impulse moves with background shading, making potential trading opportunities immediately apparent.
🔶 Custom Candle Coloring
Optional candle coloring applies the same color logic as the histogram directly to price candles, providing a unified visual framework that helps traders correlate indicator signals with price action.
🔶 Momentum Shift Detection
Automatically identifies important zero-line crossovers that often signify the beginning of new impulse moves. These transition points frequently offer favorable risk/reward entry opportunities.
🔶 Snapshot samples
1 Week
1 Day
15 Min
🔶 Why Choose AE - Impulse Volume Oscillator?
This indicator provides a comprehensive approach to identifying significant market moves by combining volume analysis with price momentum. By offering clear visual signals for both trend continuation and reversal scenarios, it empowers traders to make more informed decisions across various market conditions and timeframes.

Neural Pulse System [Alpha Extract]Neural Pulse System (NPS)
The Neural Pulse System (NPS) is a custom technical indicator that analyzes price action through a probabilistic lens, offering a dynamic view of bullish and bearish tendencies.
Unlike traditional binary classification models, NPS employs Ordinary Least Squares (OLS) regression with dynamically computed coefficients to produce a smooth probability output ranging from -1 to 1.
Paired with ATR-based bands, this indicator provides an intuitive and volatility-aware approach to trend analysis.
🔶 CALCULATION
The Neural Pulse System utilizes OLS regression to compute probabilities of bullish or bearish price action while incorporating ATR-based bands for volatility context:
Dynamic Coefficients: Coefficients are recalculated in real-time and scaled up to ensure the regression adapts to evolving market conditions.
Ordinary Least Squares (OLS): Uses OLS regression instead of gradient descent for more precise and efficient coefficient estimation.
ATR Bands: Smoothed Average True Range (ATR) bands serve as dynamic boundaries, framing the regression within market volatility.
Probability Output: Instead of a binary result, the output is a continuous probability curve (-1 to 1), helping traders gauge the strength of bullish or bearish momentum.
Formula:
OLS Regression = Line of best fit minimizing squared errors
Probability Signal = Transformed regression output scaled to -1 (bearish) to 1 (bullish)
ATR Bands = Smoothed Average True Range (ATR) to frame price movements within market volatility
🔶 DETAILS
📊 Visual Features:
Probability Curve: Smooth probability signal ranging from -1 (bearish) to 1 (bullish)
ATR Bands: Price action is constrained within volatility bands, preventing extreme deviations
Color-Coded Signals:
Blue to Green: Increasing probability of bullish momentum
Orange to Red: Increasing probability of bearish momentum
Interpretation:
Bullish Bias: Probability output consistently above 0 suggests a bullish trend.
Bearish Bias: Probability output consistently below 0 indicates bearish pressure.
Reversals: Extreme values near -1 or 1, followed by a move toward 0, may signal potential trend reversals.
🔶 EXAMPLES
📌 Trend Identification: Use the probability output to gauge trend direction.
📌Example: On a 1-hour chart, NPS moves from -0.5 to 0.8 as price breaks resistance, signaling a bullish trend.
Reversal Signals: Watch for probability extremes near -1 or 1 followed by a reversal toward 0.
Example: NPS hits 0.9, price touches the upper ATR band, then both retreat—indicating a potential pullback.
📌 Example snapshots:
Volatility Context: ATR bands help assess whether price action aligns with typical market conditions.
Example: During low volatility, the probability signal hovers near 0, and ATR bands tighten, suggesting a potential breakout.
🔶 SETTINGS
Customization Options:
ATR Period – Defines lookback length for ATR calculation (shorter = more responsive, longer = smoother).
ATR Multiplier – Adjusts band width for better volatility capture.
Regression Length – Controls how many bars feed into the coefficient calculation (longer = smoother, shorter = more reactive).
Scaling Factor – Adjusts the strength of regression coefficients.
Output Smoothing – Option to apply a moving average for a cleaner probability curve

Market Participation Index [PhenLabs]📊 Market Participation Index
Version: PineScript™ v6
📌 Description
Market Participation Index is a well-evolved statistical oscillator that constantly learns to develop by adapting to changing market behavior through the intricate mathematical modeling process. MPI combines different statistical approaches and Bayes’ probability theory of analysis to provide extensive insight into market participation and building momentum. MPI combines diverse statistical thinking principles of physics and information and marries them for subtle changes to occur in markets, levels to become influential as important price targets, and pattern divergences to unveil before it is visible by analytical methods in an old-fashioned methodology.
🚀 Points of Innovation:
Automatic market condition detection system with intelligent preset selection
Multi-statistical approach combining classical and advanced metrics
Fractal-based divergence system with quality scoring
Adaptive threshold calculation using statistical properties of current market
🚨 Important🚨
The ‘Auto’ mode intelligently selects the optimal preset based on real-time market conditions, if the visualization does not appear to the best of your liking then select the option in parenthesis next to the auto mode on the label in the oscillator in the settings panel.
🔧 Core Components
Statistical Foundation: Multiple statistical measures combined with weighted approach
Market Condition Analysis: Real-time detection of market states (trending, ranging, volatile)
Change Point Detection: Bayesian analysis for finding significant market structure shifts
Divergence System: Fractal-based pattern detection with quality assessment
Adaptive Visualization: Dynamic color schemes with context-appropriate settings
🔥 Key Features
The indicator provides comprehensive market analysis through:
Multi-statistical Oscillator: Combines Z-score, MAD, and fractal dimensions
Advanced Statistical Components: Includes skewness, kurtosis, and entropy analysis
Auto-preset System: Automatically selects optimal settings for current conditions
Fractal Divergence Analysis: Detects and grades quality of divergence patterns
Adaptive Thresholds: Dynamically adjusts overbought/oversold levels
🎨 Visualization
Color-coded Oscillator: Gradient-filled oscillator line showing intensity
Divergence Markings: Clear visualization of bullish and bearish divergences
Threshold Lines: Dynamic or fixed overbought/oversold levels
Preset Information: On-chart display of current market conditions
Multiple Color Schemes: Modern, Classic, Monochrome, and Neon themes
Classic
Modern
Monochrome
Neon
📖 Usage Guidelines
The indicator offers several customization options:
Market Condition Settings:
Preset Mode: Choose between Auto-detection or specific market condition presets
Color Theme: Select visual theme matching your chart style
Divergence Labels: Choose whether or not you’d like to see the divergence
✅ Best Use Cases:
Identify potential market reversals through statistical divergences
Detect changes in market structure before price confirmation
Filter trades based on current market condition (trending vs. ranging)
Find optimal entry and exit points using adaptive thresholds
Monitor shifts in market participation and momentum
⚠️ Limitations
Requires sufficient historical data for accurate statistical analysis
Auto-detection may lag during rapid market condition changes
Advanced statistical calculations have higher computational requirements
Manual preset selection may be required in certain transitional markets
💡 What Makes This Unique
Statistical Depth: Goes beyond traditional indicators with advanced statistical measures
Adaptive Intelligence: Automatically adjusts to current market conditions
Bayesian Analysis: Identifies statistically significant change points in market structure
Multi-factor Approach: Combines multiple statistical dimensions for confirmation
Fractal Divergence System: More robust than traditional divergence detection methods
🔬 How It Works
The indicator processes market data through four main components:
Market Condition Analysis:
Evaluates trend strength, volatility, and price patterns
Automatically selects optimal preset parameters
Adapts sensitivity based on current conditions
Statistical Oscillator:
Combines multiple statistical measures with weights
Normalizes values to consistent scale
Applies adaptive smoothing
Advanced Statistical Analysis:
Calculates higher-order statistical moments
Applies information-theoretic measures
Detects distribution anomalies
Divergence Detection:
Uses fractal theory to identify pivot points
Detects and scores divergence quality
Filters signals based on current market phase
💡 Note:
The Market Participation Index performs optimally when used across multiple timeframes for confirmation. Its statistical foundation makes it particularly valuable during market transitions and periods of changing volatility, where traditional indicators often fail to provide clear signals.

Price Change IndicatorPrice Change Indicator (PCI)
Version: 1.0
Author: LazyTrader 🚀
🔍 Overview
The Price Change Indicator (PCI) helps traders visualize and compare price changes between the current bar and the previous bar. It provides a customizable display of price changes in two formats:
Percentage (%) Change – Relative price movement.
Natural Change – Absolute difference in price units.
⚙️ Key Features
✅ Customizable Calculation Method: Choose how the price change is calculated:
Opening Price
Closing Price
High
Low
✅ Flexible Display Format:
Show Percentage (%) Change.
Show Natural (Absolute) Change in price.
✅ Adjustable Sensitivity with Multiplier:
100 (Standard Change)
1000 (Small Change)
10000 (Tiny Change)
✅ Intuitive Labeling:
Green label (above bar) for increase.
Red label (below bar) for decrease.
No label if no change.
Large, easy-to-read labels for better visibility.
✅ Perfect for Any Market:
Stocks 📈
Forex 💱
Crypto 🚀
Commodities 🛢️
📊 How It Works
The indicator calculates the difference between the current and previous bar’s price based on your chosen method.
The result is displayed as either a percentage (%) or a natural price change.
If the price has increased, a green label is displayed above the bar.
If the price has decreased, a red label is displayed below the bar.
⚡ How to Use
Add the indicator to your chart.
Go to settings and customize:
Select calculation method (Open, Close, High, Low).
Choose display format (% or Natural Change).
Adjust multiplier for more sensitivity.
Analyze the labels to see price movements easily!
🔧 Settings Explained
Setting Description
Price Calculation Method: Choose Open, Close, High, or Low price for comparison.
Display Format: Show either % Change or Natural Change.
Multiplier: Apply 100, 1000, or 10000 to scale small price changes.
Show Labels: Toggle labels on/off.
🎯 Best Use Cases
🔹 Identifying strong price movements
🔹 Spotting trends and momentum shifts
🔹 Comparing price movement intensity
🔹 Works for scalping, swing trading, and long-term analysis

Choppiness IndexThis Pine Script v6 indicator calculates the Choppiness Index over a user-defined length and segments it based on user-defined thresholds for choppy and trending market conditions. The indicator allows users to toggle the visibility of choppy, trending, and neutral segments using checkboxes.
Here's how it works:
Inputs: Users can set the length for the Choppiness Index calculation and thresholds for choppy and trending conditions. They can also choose which segments to display.
Choppiness Index Calculation: The script calculates the Choppiness Index using the ATR and the highest-high and lowest-low over the specified length.
Segment Determination: The script determines which segment the current Choppiness Index value falls into based on the thresholds. The color changes exactly at the threshold values.
Dynamic Plotting: The Choppiness Index is plotted with a color that changes based on the segment. The plot is only visible if the segment is "turned on" by the user.
Threshold Lines: Dashed horizontal lines are plotted at the choppy and trending thresholds for reference.
This indicator helps traders visualize market conditions and identify potential transitions between choppy and trending phases, with precise color changes at the threshold values.

Improved G-Trend DetectionIt is the Improved version of G trend channel detection.
The Umair Trend Detection Indicator is a powerful tool designed to help traders identify potential buy and sell opportunities by combining dynamic price channels with RSI-based confirmation. This indicator is suitable for all types of financial markets, including stocks, forex, and cryptocurrencies.
Key Features:
Dynamic G-Channels
Calculates upper, lower, and average price channels based on the "G-Channel" methodology.
Helps identify market extremes and potential reversal points.
RSI Confirmation
Integrates RSI (Relative Strength Index) to filter buy and sell signals.
Avoids false signals by ensuring market momentum aligns with trend direction.
Buy/Sell Signals
Generates "Buy" signals when bullish conditions align with oversold RSI levels.
Generates "Sell" signals when bearish conditions align with overbought RSI levels.
Exit Signals
Provides optional exit points for both long and short positions using a buffer for confirmation.
Visual Clarity
Displays clearly plotted channels and average lines to help visualize price trends.
Buy and sell signals are marked with arrows for easy identification on the chart.
Custom Alerts
Offers customizable alerts for buy, sell, and exit conditions, ensuring traders never miss an opportunity.
Input Parameters:
Channel Length: Controls the sensitivity of the G-Channels.
Multiplier: Adjusts the width of the channels to suit different market conditions.
RSI Settings: Customize RSI length and thresholds for overbought/oversold conditions.
Exit Signal Buffer: Adds flexibility to the exit strategy by delaying signals for confirmation.
How It Helps:
The Umair Trend Detection Indicator is perfect for traders looking for an easy-to-use trend-following system with strong confirmation. By combining dynamic channels with RSI, it provides accurate and reliable signals to enter and exit trades, minimizing risks associated with false breakouts or trend reversals.
Use Cases:
Trend Trading: Identify and follow long-term trends with confidence.
Swing Trading: Spot reversals and capitalize on medium-term price movements.
Risk Management: Use exit signals to lock in profits or limit losses effectively.
This indicator is a versatile tool for both novice and experienced traders. Fine-tune its settings to align with your trading style and improve your decision-making in any market.

TechniTrend: Advance Custom Candle Finder (CCF)🟦 Description:
The TechniTrend: Advanced Custom Candle Finder (CCF) is a versatile tool designed to help traders identify custom candlestick patterns using various configurable criteria. This indicator provides a flexible framework to filter and highlight specific candles based on volume, volatility, candle characteristics, and other important metrics. Below is a detailed explanation of each filter and its customization options:
🟦 Volume-Based Filters
🔸Volume Spike Filter:
Enable filtering based on volume spikes. Use the Volume Spike Multiplier to define what constitutes a significant increase in volume compared to the average. A spike indicates unusually high trading interest.
🔸Volume Range Filter:
Filter candles based on specific volume ranges. Set Minimum Volume and Maximum Volume thresholds to isolate candles with trading volumes within your desired boundaries.
🟦 Candle Body & Wick Filters
🔸Body Size Filter:
Filter candles based on the size of their body. A Body Size Multiplier determines what is considered a large body relative to historical averages.
🔸Body Percentage Filter:
Filter based on the proportion of the body to the entire candle size. Use the Body Percentage Threshold to highlight candles where the body makes up a certain percentage of the total candle range.
🔸Wick-to-Body Ratio Filter:
Identify candles with specific wick-to-body ratios. A higher Wick-to-Body Ratio can indicate indecision or reversals.
🟦 Volatility & Range Filters
🔸Volatility Filter:
Highlight candles based on price changes relative to volume. The Volatility Multiplier sets the threshold for what is considered a volatile candle.
🔸Candle Range Filter:
Filter based on the range (High - Low) of each candle. Use Minimum Candle Range and Maximum Candle Range to specify your desired candle size in points or pips.
🔸Short-Term and Long-Term Volatility Filters:
Analyze volatility over different periods. Enable Short-Term Volatility or Long-Term Volatility filters to compare recent volatility against historical averages, helping you detect sudden market shifts.
🟦 Candle Color & Open/Close Filters
🔸Candle Color Filter:
Filter based on the candle's color. Choose between Bullish (close > open) or Bearish (close < open) to focus on specific market sentiments.
🔸Open/Close Price Range Filter:
Filter based on the difference between the open and close prices. Use Minimum Open/Close Range and Maximum Open/Close Range to specify your acceptable range in price movements.
🟦 Core Functionality
The CCF indicator combines these filters to provide a final signal whenever a candle meets all the enabled criteria. By default, it highlights any qualifying candle directly on the chart and changes the background color for added visibility.
🟦 Key Features:
🔸Highly Customizable Filters: Adjust the parameters for each filter to tailor the indicator to your specific needs.
🔸Multiple Conditions: Combine several conditions to identify complex candlestick patterns.
🔸Real-Time Alerts: Receive instant notifications when a matching candle pattern is found based on your custom criteria.
🟦 How to Use:
🔸Enable the filters you wish to apply (e.g., Volume Spike, Candle Body Size, Volatility).
🔸Adjust the thresholds for each filter to fine-tune the pattern recognition criteria.
🔸Observe the chart to see visual cues for candles that match your specified conditions.
🟦 Notes:
🔸Ensure that you clearly understand each filter’s role. Over-filtering with very strict criteria may reduce the number of signals.
🔸This indicator is designed to be a customizable tool, not providing buy or sell recommendations.
🔸Use in combination with other analysis tools and indicators for the best results.

Dema Percentile Standard DeviationDema Percentile Standard Deviation
The Dema Percentile Standard Deviation indicator is a robust tool designed to identify and follow trends in financial markets.
How it works?
This code is straightforward and simple:
The price is smoothed using a DEMA (Double Exponential Moving Average).
Percentiles are then calculated on that DEMA.
When the closing price is below the lower percentile, it signals a potential short.
When the closing price is above the upper percentile and the Standard Deviation of the lower percentile, it signals a potential long.
Settings
Dema/Percentile/SD/EMA Length's: Defines the period over which calculations are made.
Dema Source: The source of the price data used in calculations.
Percentiles: Selects the type of percentile used in calculations (options include 60/40, 60/45, 55/40, 55/45). In these settings, 60 and 55 determine percentile for long signals, while 45 and 40 determine percentile for short signals.
Features
Fully Customizable
Fully Customizable: Customize colors to display for long/short signals.
Display Options: Choose to show long/short signals as a background color, as a line on price action, or as trend momentum in a separate window.
EMA for Confluence: An EMA can be used for early entries/exits for added signal confirmation, but it may introduce noise—use with caution!
Built-in Alerts.
Indicator on Diffrent Assets
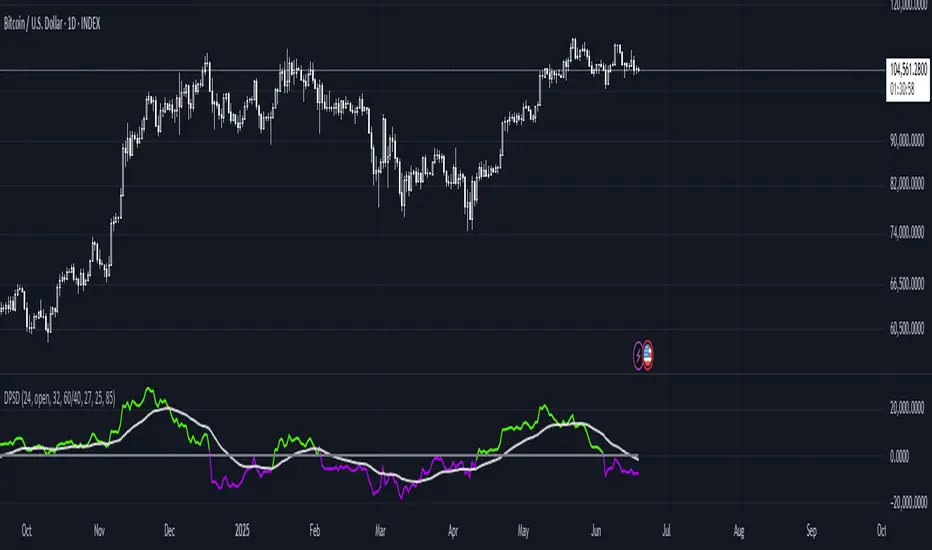
INDEX:BTCUSD 1D Chart (6 high 56 27 60/45 14)
CRYPTO:SOLUSD 1D Chart (24 open 31 20 60/40 14)
CRYPTO:RUNEUSD 1D Chart (10 close 56 14 60/40 14)
Remember no indicator would on all assets with default setting so FAFO with setting to get your desired signal.