Daily Dax Strategy
-----------------
Hey there!
There are a lot of reasons why this strategy has performed very well in recent years.
A very simple strategy in itself. The system basically follows the trend following approach. The focus is always on rising trends. No action takes place during falling trends. Both time filters and trend filters are used. There is only one position per day which is compulsorily closed again at the end of the time filter.
Only for CURRENCYCOM:DE30 !
The indicator is designed for the h1 hourly chart. In addition, the display can be adjusted using the options.
That's all. Due to the economic background, the strategy can be used without a large technical chart analysis.
Warning: Before contacting a position, it is always more important than having strong news. Better to play it safe in these same ones.
Caution: With this strategy, as an exception, no SL is allowed by default. Therefore always calculate the risk carefully.
Past results do not guarantee future profits!
Follow the link below to get access to this indicator or get us a PM to get access.
--------------------------------------------------------------------------------------------------------------
--------------------------------------------------------------------------------------------------------------
-----------------
Willkommen!
Es gibt viele Gründe, warum sich diese Strategie in den letzten Jahren ganz gut bewährt hat.
Eine sehr einfache Strategie für sich. Grundsätzlich folgt das System dem Trendfolge Ansatz. Es wird immer nur auf steigende Trends gesetzt. Während fallenden Trends finden keine Aktionen statt. Es werden sowohl Zeitfilter als auch Trendfilter verwendet. Es gibt nur eine Position am Tag welche zwingend auch am Ende des Zeitfilters wieder geschlossen wird.
Only for CURRENCYCOM:DE30 !
Der Indikator ist für den h1 Stundechart ausgelegt. Zusätzlich kann die Anzeige über die Optionen angepasst werden.
Das ist alles. Aufgrund des wirtschaftlichen Hintergrunds kann die Strategie ohne umfangreiche technische Chartanalyse verwendet werden.
Achtung: Vor dem Öffnen einer Positionen immer zuerst prüfen ob starke News anstehen. In diesen Fällen lieber auf Nummer sicher gehen.
Achtung: Bei dieser Strategie ist standardmäßig ausnahmsweise kein SL vorgesehen. Daher das Risiko Immer gut kalkulieren.
Vergangene Ergebnisse garantieren keine zukünftigen Gewinne!
Verwenden Sie den folgenden Link, um Zugriff auf diesen Indikator zu erhalten oder schreibe uns eine PM um Zugriff zu erhalten.
Trendfolge

#JJ_Shares Trend Follower
-----------------
Hey there!
There are many reasons why this strategy has worked quite well over the past few years.
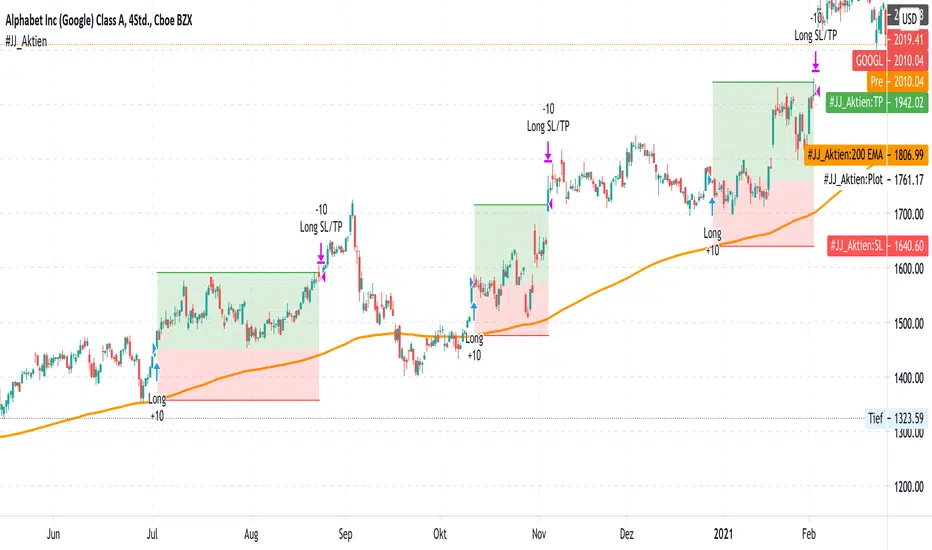
A very simple strategy in itself. The basis of this indicator is the trend following approach. "The trend is your friend." This strategy is based on individual separate indicators. A total of three EMA's (10.50 & 200) & the ATR are combined. The largest EMA shows the basic trend direction and thus also the preferred trade direction. The two smaller EMAs are used for the timing of the entrances at the intersection. The stop levels are placed with the help of the ATR and the large EMA. Profit areas are determined using a risk calculation.
Exact entry points can be identified using the indicator. In addition, a take profit is visualized based on a 3:1 CRV . The stop loss results from a long-term EMA .
Example for NASDAQ:GOOGL ! But can be used for all other trend following stocks!
The indicator can be used on all timeframes. However, the performance is significantly better in higher timeframes. In addition, the display can be adjusted using the options.
That's all. Due to the technical chart background, the strategy can be used without further chart analysis.
Attention: Before opening a position, always first check whether there is any strong news. In these cases it is better to be on the safe side.
Attention: With this strategy a SL is provided as standard. However, the risk must always be carefully calculated.
Past results do not guarantee future profits!
Use the link below to get access to this indicator or PM us to get access.
--------------------------------------------------------------------------------------------------------------
--------------------------------------------------------------------------------------------------------------
-----------------
Willkommen!
Es gibt viele Gründe, warum sich diese Strategie in den letzten Jahren ganz gut bewährt hat.
Eine sehr einfache Strategie für sich. Grundlage dieses Indikators ist der Trendfolgeansatz. "The trend is your friend." Diese Strategie basiert auf einzelnen seperaten Indikatoren. Insgesamt werden drei EMA's (10,50 & 200) & die ATR kombiniert. Der größte EMA zeigt die grundsätzliche Trendrichtung und somit auch die bevorzugte Traderichtung. Die beiden kleineren EMA werden bei Kreuzung für das Timing der Einstiege verwendet. Mit Hilfe der ATR und des großen EMA werden die Stop Level platziert. Gewinnzonen werden über eine Risikoberechnung ermittelt.
Anhand des Indikators können genaue Einstiege erkannt werden. Zusätzlich wird aufgrund eines 3:1 CRV ein Take Profit visualisiert. Der Stop Loss ergibt sich über einen langfristigen EMA .
Beispiel für NASDAQ:GOOGL ! Kann aber für alle weiteren Trendfolge Aktien verwendet werden!
Der Indikator kann auf allen Timeframes angewendet werden. Allerdings ist der Performance in höheren Timeframes deutlich besser. Zusätzlich kann die Anzeige über die Optionen angepasst werden.
Das ist alles. Aufgrund des charttechnischen Hintergrunds kann die Strategie ohne weitere Chartanalyse verwendet werden.
Achtung: Vor dem Öffnen einer Position immer zuerst prüfen ob starke News anstehen. In diesen Fällen lieber auf Nummer sicher gehen.
Achtung: Bei dieser Strategie ist standardmäßig ein SL vorgesehen. Das Risiko muss aber immer gut kalkuliert werden.
Vergangene Ergebnisse garantieren keine zukünftigen Gewinne!
Verwenden Sie den folgenden Link, um Zugriff auf diesen Indikator zu erhalten oder schreibe uns eine PM um Zugriff zu erhalten.
Goersch TrendENGLISH:
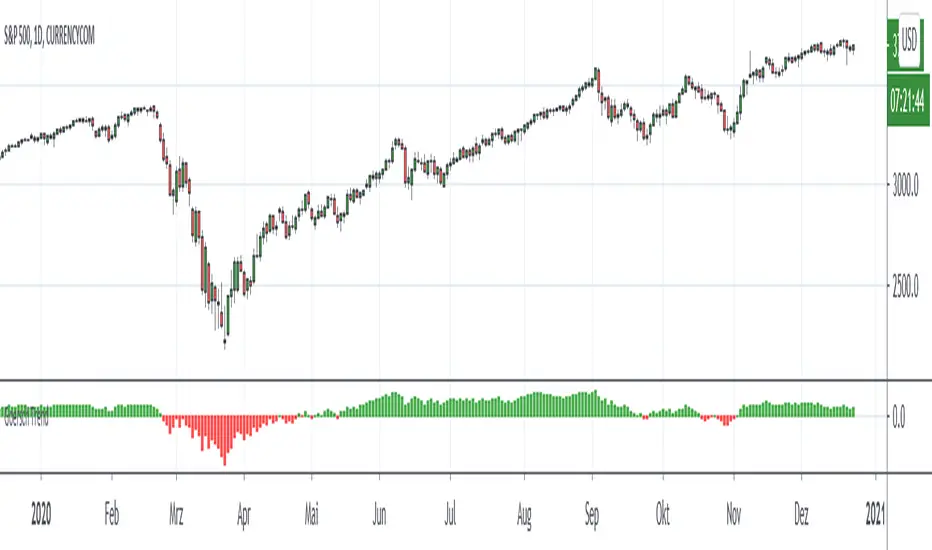
Goersch Trend Indicator for TradingView is a trend indicator that shows the actual trend and the trend strength based on the price movement of the past. The indicator can be used for any underlying and trading timeframe. The special feature is that it is extremely easy to interpret and that it works "out-of-the-box". The calculation automatically adjusts to the displayed timeframe. The interpretation of the Goersch Trned indicator is always the same - whether you are looking at a stock, a currency, an index or a commodity. Regardless of whether you work in the 5-minute chart, hourly, daily or even weekly chart. It is extremely simple to judge whether an underlying is running in a trend, whether this trend strength is currently increasing (stable) or decreasing (when the trend is weakening), or whether the trend is currently changing direction. The indicator shows you the important information at a glance.
The interpretation of the Goersch Trend indicator is very simple. Red bars represent a downward trend, green bars appear during an upward trend. The change from red to green signals a change from a downward to an upward trend and vice versa. The height of the bars represents the trend strength. The trend strength decreases when the bars become shorter. The change from red to green then signals a completed trend change.
For the calculation of the bar height, the fluctuation of a price change index is used as a basis in the Goersch Trend Indicator. The price change index is calculated from the respective candle closing price and the true high or true low of the previous candle, which is added or subtracted accordingly. From this price change index, a long-term moving average is calculated, the difference between this average and the price change index is visualized by means of the red and green bars.
To get access to the script, please PM, or send a message to the email address in the signature.
DEUTSCH:
Beim Goersch Trend Indikator für TradingView handelt es sich um einen Trend-Indikator, der anhand der Preisbewegung der Vergangenheit den Trend sowie die Trendstärke anzeigt. Verwendet werden kann der Indikator für jegliche Basiswerte und Zeiteinheiten. Das Besondere ist, dass er extrem leicht zu interpretieren ist und dass er "out-of-the-box" arbeitet. Die Berechnung passt sich automatisch auf die dargestellte Zeitebene an. So ist eine Interpretation immer gleich – egal ob Sie eine Aktie, eine Währung, einen Index oder einen Rohstoff betrachten. Unabhängig davon, ob Sie im 5-Minuten-Chart, Stunden-, Tages- oder gar Wochen-Chart arbeiten. Dabei ist es äußerst simpel zu beurteilen, ob ein Wert in einem Trend läuft, ob diese Trendstärke gerade zunimmt (also stabil ist) oder abnimmt (der Trend also schwächer wird), oder ob der Trend gerade kippt. Der Indikator zeigt Ihnen die wichtigen Informationen auf einen Blick.
Die Interpretation des Goersch Trend Indikators ist denkbar einfach. Rote Balken stehen für einen Abwärtstrend, grüne Balken erscheinen während eines Aufwärtstrends. Der Wechsel von Rot auf Grün signalisiert einen Wechsel vom Abwärts- in einen Aufwärtstrend und umgekehrt. Die Höhe der Balken repräsentiert die Trendstärke. Dadurch ergibt es sich schon, dass beispielsweise die Trendstärke abnimmt, wenn die Balken kürzer werden. Der Wechsel von Rot auf Grün signalisiert dann einen vollendeten Trendwechsel.
Für die Berechnung der Balkenhöhe wird im Goersch Trend Indikator die Schwankung eines Preisveränderungsindex zugrunde gelegt. Dieser errechnet sich aus dem jeweiligen Kerzen-Schlusskurs und dem True-High bzw. True-Low der vorhergehenden Kerze, das entsprechend hinzugerechnet oder abgezogen wird. Von diesem Preisveränderungsindex wird ein langfristiger gleitender Durchschnitt errechnet, die Differenz dieses Durchschnittes und des Preisveränderungsindex wird mittels der roten und grünen Balken visualisiert.
Um Zugang zum Skript zu erhalten, bitte eine PM, oder eine Nachricht an die Emailadresse in der Signatur.
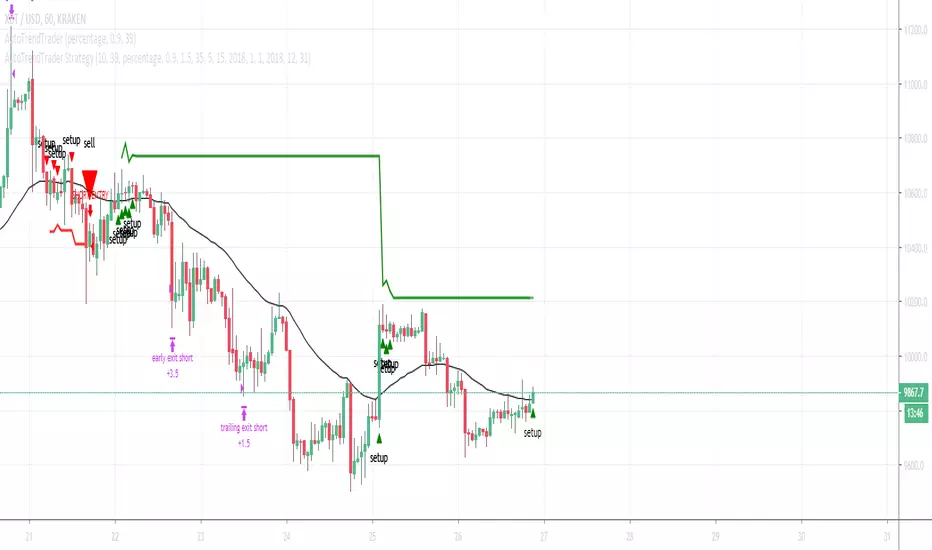
AutoTrendTrader"The Trend is your Friend" is a popular quote and Day-Traders, as well as long-term Investors, build their Strategies on top of this Mantra.
Leverage this Principle by using AutoTrendTrader to ride the Trend and let your Profits run!
Get Email-Alerts with your customized buy and sell signals, or use autoview to trigger and exit the trades.
Features:
Reliable Detection of Up- and Downtrends - this will enable you to enter strong Trends at the right time
Partial Profit Taking - Configure your perfect Mix of taking profits early vs. letting profits run
Reversing Signals - Limit your Draw-Down
Proprietary Algorithms combined with multiple Confirmations via other Technical Indicators
What's included:
AutoTrendTrader Study (generate Signals)
AutoTrendTrader Strategy (backtest your Settings)
This Study was built to be used with autoview . It generates Alerts that can be used as Entry-Signals. Taking Profits will be configured via autoview. You can configure partial profit taking via autoview and exit Positions via the reverse Signal.
But of course this Study can be used to generate Entry-Signals for any Asset and then exit Positions based on your own technical Analysis.
AutoTrendTrader Strategy"The Trend is your Friend" is a popular quote and Day-Traders, as well as long-term Investors, build their Strategies on top of this Mantra.
Leverage this Principle by using AutoTrendTrader to ride the Trend and let your Profits run!
Get Email-Alerts with your customized buy and sell signals, or use autoview to trigger and exit the trades.
Features:
Reliable Detection of Up- and Downtrends - this will enable you to enter strong Trends at the right time
Partial Profit Taking - Configure your perfect Mix of taking profits early vs. letting profits run
Reversing Signals - Limit your Draw-Down
Proprietary Algorithms combined with multiple Confirmations via other Technical Indicators
What's included:
AutoTrendTrader Study (generate Signals)
AutoTrendTrader Strategy (backtest your Settings)
