TTM Squeeze Value OscillatorThis indicator is specifically designed for use with TradingView's Stock Screener, not for chart analysis. It provides numerical values and binary signals that allow traders to efficiently scan stocks for specific TTM Squeeze conditions, momentum patterns, and EMA alignments.
What It Does
The TTM Squeeze Value Oscillator converts the popular TTM Squeeze indicator into a screenable format by outputting specific numerical values and binary signals (1 or 0) that can be filtered in TradingView's screener tool.
Key Features
1. TTM Squeeze Compression Levels
Value 0: Low Compression (Black) - Bollinger Bands inside outer Keltner Channels
Value 1: Mid Compression (Red) - Bollinger Bands inside middle Keltner Channels
Value 2: High Compression (Orange) - Bollinger Bands inside inner Keltner Channels
Value 3: Squeeze Fired (Green) - Bollinger Bands outside Keltner Channels
2. Momentum Analysis
Four distinct momentum conditions based on TTM Squeeze methodology:
Buy Momentum Increasing - Positive momentum growing stronger
Buy Momentum Decreasing - Positive momentum weakening
Sell Momentum Increasing - Negative momentum growing stronger
Sell Momentum Decreasing - Negative momentum weakening
3. EMA Stacking Analysis
Three EMA alignment patterns using 8, 21, and 48 period EMAs:
EMA Stacked Bullish - 8 EMA > 21 EMA > 48 EMA (uptrend alignment)
EMA Stacked Bearish - 8 EMA < 21 EMA < 48 EMA (downtrend alignment)
EMA Mixed - EMAs not in clear bullish or bearish alignment
4. Consecutive Day Counters
Tracks how many consecutive days each squeeze condition has persisted:
Low Compression Days
Mid Compression Days
High Compression Days
Squeeze Fired Days
5. Combined Signal Analysis
Pre-calculated combinations of squeeze conditions with momentum:
All squeeze levels combined with all four momentum conditions
16 total combined signals for advanced screening
Ttmsqueezepro

TTM Squeeze ProCredits:
-> John Carter creating the TTM Squeeze and TTM Squeeze Pro
-> Lazybear's original interpretation of the TTM Squeeze: Squeeze Momentum Indicator
-> Makit0's evolution of Lazybear's script to factor in the TTM Squeeze Pro upgrades - Squeeze PRO Arrows
This is my version of their collective works, with amendments primarily to the Squeeze Conditions to more accurately reflect the color coding used by the official TMM Squeeze Pro indicator.
For those unfamiliar with the TTM Squeeze, it is simply a visual way of seeing how Bollinger Bands (standard deviations from a simple moving average ) relate to Keltner Channels (average true range bands) compared with the momentum of the price action. The concept is that as Bollinger Bands compress within Keltner Channels, price volatility decreases, giving way for a potential explosive price movement up or down.
Differences between the original TTM Squeeze and TTM Squeeze Pro:
-> Both use a 2 standard deviation Bollinger Band ;
-> The original squeeze only used a 1.5 ATR Keltner Channel; and
-> The pro version uses 1.0, 1.5 and 2.0 ATR Keltner Channels .
The pro version therefore helps differentiate between levels of squeeze (compression) as the Bollinger Bands moves through the Keltner Channels i.e. the greater the compression, the more potential for explosive moves - less compression means more squeezing.
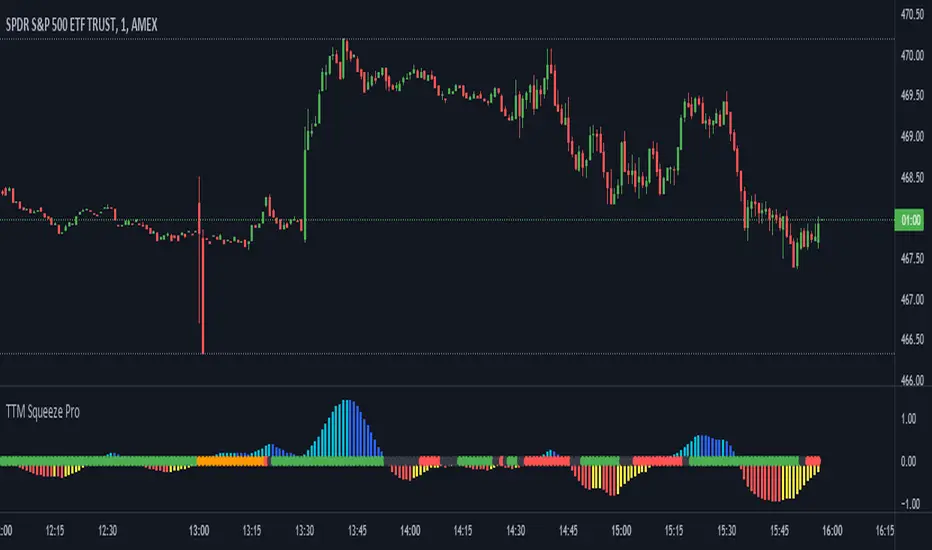
The Histogram shows price momentum whereas the colored dots (along the zeroline) show where the Bollinger Bands are in relation to the Keltner Channels:
-> Cyan Bars = positive, increasing momentum;
-> Blue Bars = positive, decreasing momentum (indication of a reversal in price direction);
-> Red Bars = negative, increasing momentum;
-> Yellow Bars = negative, decreasing momentum (indication of a reversal in price direction);
-> Orange Dots = High Compression / large squeeze (One or both of the Bollinger Bands is inside the 1st (1.0 ATR) Keltner Channel);
-> Red Dots = Medium Squeeze (One or both of the Bollinger Bands is inside the 2nd (1.5 ATR) Keltner Channel);
-> Black Dots = Low compression / wide squeeze (One or both of the Bollinger Bands is inside the 3rd (2.0 ATR) Keltner Channels );
-> Green Dots = No Squeeze / Squeeze Fired (One or both of the Bollinger Bands is outside of the 3rd (2.0 ATR) Keltner Channel).
Ideal Scenario:
As the ticker enters the squeeze, black dots would warn of the beginning of a low compression squeeze. As the Bollinger bands continue to constrict within the Keltner Channels , red dots would highlight a medium compression. As the price action and momentum continues to compress an orange dot shows warning of high compression. As price action leaves the squeeze, the coloring would reverse e.g. orange to red to black to green. Any compression squeeze is considered fired at the first green dot that appears.
Note: This is an ideal progression of the different types of squeezes, however any type of squeeze (and color sequence) may appear at anytime, therefore the focus is primarily on the green dots after any type of compression.
Entry and Exit Guide:
-> John Carter recommends entering a position after at least 5 black dots or wait for 1st green dot ; and
-> Exit on second blue or yellow bar or, alternatively, remain in the position after confirming a continuing trend through a separate indicator.