GoldBurst-15min · Gold DayTrade Session Burst StrategyWhat makes it original & useful
Session micro-structure edge – exploits two well-documented volatility pockets in spot gold:
• NY futures pit open (13:05-13:35 UTC)
• London 15 h fix (14:45-15:15 UTC)
Adaptive confirmation stack
Daily-anchored VWAP to locate fair value.
Real-time volume-spike filter (live vs. 20-bar median) to catch crowd surges.
60 min EMA slope for higher-TF trend bias (no look-ahead).
Risk in context – ATR-scaled stops/targets + bars-held timer flatten positions before liquidity evaporates.
Clean visual dashboard – live window status & bias label; uncluttered chart footprint.
How the logic fires
Step Long setup (mirror for shorts)
1 Inside active session window.
2 Volume ≥ median × Vol Spike input (default = 1.3).
3 60 m EMA rising.
4 Price closes > VWAP + 0.5 × ATR ⇒ market order next bar.
5 Exit at 1.6 × ATR TP, 0.8 × ATR SL or after 2 bars (~30 min).
Max 2 trades per window; flat outside windows.
Key inputs
Input Purpose Default
ATR Length Volatility base 20
TP / SL × ATR Reward / risk 1.6 / 0.8
Volume Spike × Median Crowd filter 1.3
Trades / Window Over-trading guard 2
Time Exit (bars) Stay-in-market cap 2
Default back-test settings (Properties → Strategy)
Chosen for realistic retail conditions; please adjust to suit your broker.
Capital: 100 000 USD
Order size: 1 % of equit
Commission: 0.15 USD/contract
Slippage: 5 ticks
Pyramiding: 1
Recalculate: on bar close, bar-magnifier ON
Dataset: XAUUSD, 15 min
How to use it
Load on a 15 min XAUUSD chart set to UTC.
Keep default Inputs first; tweak ATR multiples or volume factor only after validating.
Combine with macro or DXY overlays to avoid trading into major news spikes.
Limitations & risk notice
Designed for spot gold only; other metals require re-tuning.
Highly dependent on tight spreads during bursts—use an ECN broker.
Past performance ≠ future results; test forward on demo before going live.
Volaility
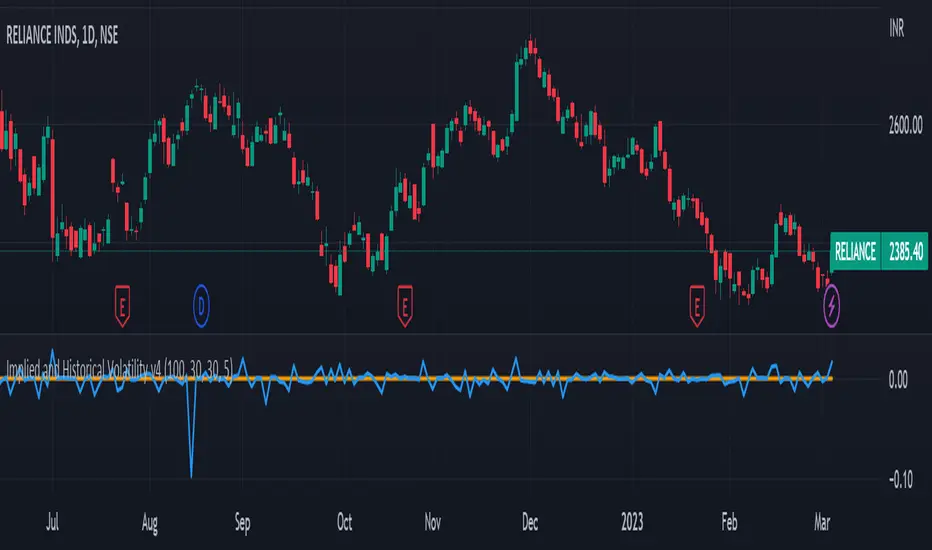
Implied and Historical Volatility v4There is a famous option strategy📊 played on volatility📈. Where people go short on volatility, generally, this strategy is used before any significant event or earnings release. The basic phenomenon is that the Implied Volatility shoots up before the event and drops after the event, while the volatility of the security does not increase in most of the scenarios. 💹
I have tried to create an Indicator using which you
can analyse the historical change in Implied Volatility Vs Historic Volatility.
To get a basic idea of how the security moved during different events.
Notes:
a) Implied Volatility is calculated using the bisection method and Black 76 model option pricing model.
b) For the risk-free rate I have fetched the price of the “10-Year Indian Government Bond” price and calculated its yield to be used as our Risk-Free rate.
MOVE/VXTLT CorrelationMany know of the VIX for equity trading. Yet, many are unaware that there is the same kind of volatility measure for trading bonds, called the MOVE Index.
"The Merrill Lynch Option Volatility Estimate (MOVE) Index is a yield curve weighted index of the normalized implied volatility on 1-month Treasury options which are weighted on the 2, 5, 10, and 30 year contracts."
With this script one can see the the correlation and divergences between bonds and its volatility measure to make educated decisions in trading or hedging.
The idea of this script comes from NicTheMajestic.
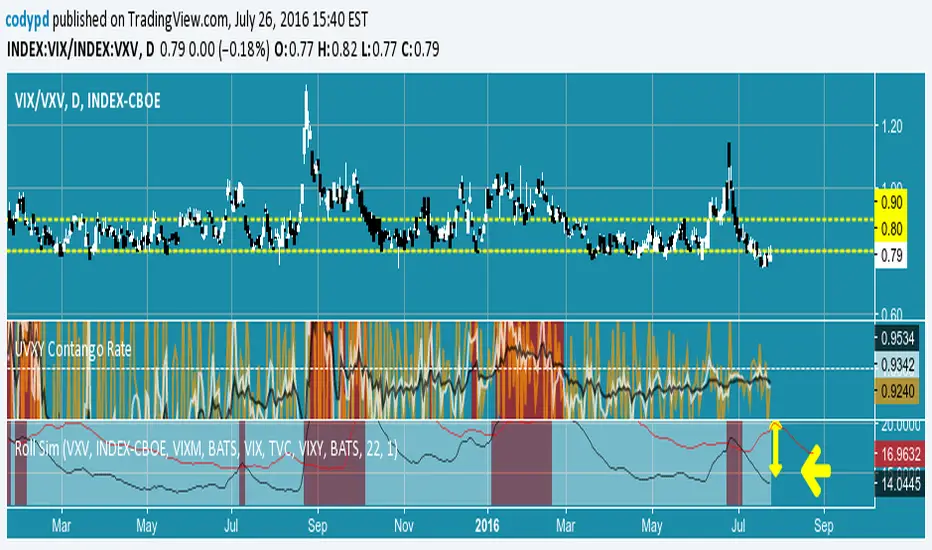
UVXY Contango Rate - my quick and dirty indicatorFeel the force ... read the source.
Give you an idea of the contango headwind / backwardation tailwind that UVXY is experiencing.
Works on Daily time frame only unless you buy the VIX feed.