[LJ] HTF Candles with Volume POC [Highly Optimized]Welcome to the ultimate Higher Timeframe (HTF) fusion tool.
This indicator seamlessly merges Higher Timeframe price action with precise volume profiling on Lower Timeframe (LTF) charts. By utilizing advanced array memory management, it bypasses TradingView's drawing limits to render clean HTF candle boxes and their exact Volume Point of Control (POC), ensuring peak performance and accuracy even on extreme timeframe combinations.
🔎 Visual Guide: What's on Your Chart?
The Big Boxes (Wick & Body): These represent the Open, High, Low, and Close of your selected Higher Timeframe (e.g., a 1-Hour candle projected onto your 5-Minute chart). Color-coded for bullish/bearish momentum.
The Midline: A horizontal line dividing the HTF candle perfectly in half. Useful for gauging if LTF price is in a "premium" or "discount" zone relative to the HTF.
The Yellow Box (The POC): This is the Point of Control. When an HTF candle closes, this yellow box locks in place, showing the exact price zone that saw the highest volume accumulation during that period, calculated using precise LTF hlc3 price data.
⚙️ Key Settings & Configuration
To get the most out of this indicator, check these inputs in the settings menu:
Box Time Interval: Set this to your desired HTF (e.g., "1H", "4H", "D").
Tip: A good rule of thumb is an HTF that is 5x to 12x higher than your current chart.
POC Resolution (Levels): This is your fine-tuning dial.
Set to 50 - 100: Creates a very thin, precise POC line. Great for exact support/resistance levels.
Set to 15 - 35: Creates a thicker POC "Zone". Great for capturing broader areas of high liquidity.
Max Historical Boxes: Controls how far back the indicator draws. Keep this at 50 for a clean chart and fast loading times.
📈 Trading Strategies: How to Trade the HTF POC
1. The "Magnet" Mean Reversion High volume nodes (POCs) act as price magnets. If the current LTF price is far away from the previous HTF candle's POC, look for setups that trade back toward that yellow box.
2. The Break & Retest The POC box acts as a heavy Support/Resistance wall. If price breaks through the yellow POC box with strong momentum, look to enter on the retest of that box in the direction of the breakout.
3. Trend Continuation In a strong uptrend, look for the current LTF price to bounce off the Midline or the previous candle's POC to join the dominant HTF trend.
⚡ Performance Note
This indicator uses advanced Pine Script Array Management. Unlike standard volume profile scripts that crash when calculating big timeframes, this indicator guarantees zero lag and no disappearing boxes, even when looking at a Daily HTF on a 1-Minute chart.
🙏 Credits
This is a refactored and heavily optimized fusion of two great concepts:
Original HTF Box logic by © krollo041
Original Volume Thermometer concept by © ChartPrime
Merged, debugged, and optimized for v6 Array Management by ©Luki_eR
Disclaimer: This script is for educational and informational purposes only and does not constitute financial advice.
Volumeprofiler

Volume Profile Area [BigBeluga]🔵 OVERVIEW
The Volume Profile Area is an advanced profiling tool that calculates and visualizes the value area within a chosen period’s volume distribution. It first builds a main profile of the entire range, then constructs a secondary profile inside the defined value area, allowing traders to examine market balance and key trading zones in greater detail.
🔵 CONCEPTS
Volume Profile – Distributes traded volume across price levels to highlight areas of market activity.
Value Area (VA) – The price range containing a chosen percentage of total volume (commonly 50–70%).
Point of Control (PoC) – The price level with the highest traded volume, often acting as a magnet for price.
Nested Profiles – A profile inside the VA adds a second layer of precision, showing where liquidity clusters within the “fair value” zone.
🔵 FEATURES
Main Profile – Full distribution of volume over the selected lookback period.
Secondary Profile – Built only inside the VA of the main profile, highlighting intrabalance structure.
Customizable PoC Selection – Choose between showing the PoC of the
Main Profile ,
the Area Profile ,
their Average ,
or None .
Dynamic Value Area Levels – Automatically plots VAL (Value Area Low) and VAH (Value Area High) with labels.
Overlay Toggles – Show/hide range extremes, VA lines, or PoCs for a cleaner chart view.
Visual Profiles – Main profile shaded in darker blue; the VA profile inside is lighter for clear separation.
Automatic Scaling – Profiles adapt to period highs/lows and auto-adjust bins for consistent resolution.
Volume Labels – PoCs can display traded volume, giving numeric confirmation of liquidity concentration.
🔵 HOW TO USE
Set the Period to define how many bars to include in the main profile.
Adjust the Value Area % to control how much volume defines the VA (e.g., 50% by default).
Pick your PoC option: Main , Area , or Average , depending on focus.
Use VAH/VAL lines as support/resistance levels where most trading occurred.
Compare reactions at Main vs VA PoC levels to spot potential breakouts or mean reversions.
🔵 CONCLUSION
The Volume Profile Area extends traditional profiling by nesting a secondary VA profile inside the main distribution. This dual-layer approach reveals not just where the market was active overall, but where liquidity concentrated within the “fair value” zone—powerful for refining entries, exits, and risk placement across intraday and swing horizons.

Advanced Volume Profile Pro Delta + POC + VAH/VAL# Advanced Volume Profile Pro - Delta + POC + VAH/VAL Analysis System
## WHAT THIS SCRIPT DOES
This script creates a comprehensive volume profile analysis system that combines traditional volume-at-price distribution with delta volume calculations, Point of Control (POC) identification, and Value Area (VAH/VAL) analysis. Unlike standard volume indicators that show only total volume over time, this script analyzes volume distribution across price levels and estimates buying vs selling pressure using multiple calculation methods to provide deeper market structure insights.
## WHY THIS COMBINATION IS ORIGINAL AND USEFUL
**The Problem Solved:** Traditional volume indicators show when volume occurs but not where price finds acceptance or rejection. Standalone volume profiles lack directional bias information, while basic delta calculations don't provide structural context. Traders need to understand both volume distribution AND directional sentiment at key price levels.
**The Solution:** This script implements an integrated approach that:
- Maps volume distribution across price levels using configurable row density
- Estimates delta (buying vs selling pressure) using three different methodologies
- Identifies Point of Control (highest volume price level) for key support/resistance
- Calculates Value Area boundaries where 70% of volume traded
- Provides real-time alerts for key level interactions and volume imbalances
**Unique Features:**
1. **Developing POC Visualization**: Real-time tracking of Point of Control migration throughout the session via blue dotted trail, revealing institutional accumulation/distribution patterns before they complete
2. **Multi-Method Delta Calculation**: Price Action-based, Bid/Ask estimation, and Cumulative methods for different market conditions
3. **Adaptive Timeframe System**: Auto-adjusts calculation parameters based on chart timeframe for optimal performance
4. **Flexible Profile Types**: N Bars Back (precise control), Days Back (calendar-based), and Session-based analysis modes
5. **Advanced Imbalance Detection**: Identifies and highlights significant buying/selling imbalances with configurable thresholds
6. **Comprehensive Alert System**: Monitors POC touches, Value Area entry/exit, and major volume imbalances
## HOW THE SCRIPT WORKS TECHNICALLY
### Core Volume Profile Methodology:
**1. Price Level Distribution:**
- Divides price range into user-defined rows (10-50 configurable)
- Calculates row height: `(Highest Price - Lowest Price) / Number of Rows`
- Distributes each bar's volume across price levels it touched proportionally
**2. Delta Volume Calculation Methods:**
**Price Action Method:**
```
Price Range = High - Low
Buy Pressure = (Close - Low) / Price Range
Sell Pressure = (High - Close) / Price Range
Buy Volume = Total Volume × Buy Pressure
Sell Volume = Total Volume × Sell Pressure
Delta = Buy Volume - Sell Volume
```
**Bid/Ask Estimation Method:**
```
Average Price = (High + Low + Close) / 3
Buy Volume = Close > Average ? Volume × 0.6 : Volume × 0.4
Sell Volume = Total Volume - Buy Volume
```
**Cumulative Method:**
```
Buy Volume = Close > Open ? Volume : Volume × 0.3
Sell Volume = Close ≤ Open ? Volume : Volume × 0.3
```
**3. Point of Control (POC) Identification:**
- Scans all price levels to find maximum volume concentration
- POC represents the price level with highest trading activity
- Acts as significant support/resistance level
- **Developing POC Feature**: Tracks POC evolution in real-time via blue dotted trail, showing how institutional interest migrates throughout the session. Upward POC migration indicates accumulation patterns, downward migration suggests distribution, providing early trend signals before price confirmation.
**4. Value Area Calculation:**
- Starts from POC and expands up/down to encompass 70% of total volume
- VAH (Value Area High): Upper boundary of value area
- VAL (Value Area Low): Lower boundary of value area
- Expansion algorithm prioritizes direction with higher volume
**5. Adaptive Range Selection:**
Based on profile type and timeframe optimization:
- **N Bars Back**: Fixed lookback period with performance optimization (20-500 bars)
- **Days Back**: Calendar-based analysis with automatic timeframe adjustment (1-365 days)
- **Session**: Current trading session or custom session times
### Performance Optimization Features:
- **Sampling Algorithm**: Reduces calculation load on large datasets while maintaining accuracy
- **Memory Management**: Clears previous drawings to prevent performance degradation
- **Safety Constraints**: Prevents excessive memory usage with configurable limits
## HOW TO USE THIS SCRIPT
### Initial Setup:
1. **Profile Configuration**: Select profile type based on trading style:
- N Bars Back: Precise control over data range
- Days Back: Intuitive calendar-based analysis
- Session: Real-time session development
2. **Row Density**: Set number of rows (30 default) - more rows = higher resolution, slower performance
3. **Delta Method**: Choose calculation method based on market type:
- Price Action: Best for trending markets
- Bid/Ask Estimate: Good for ranging markets
- Cumulative: Smoothed approach for volatile markets
4. **Visual Settings**: Configure colors, position (left/right), and display options
### Reading the Profile:
**Volume Bars:**
- **Length**: Represents relative volume at that price level
- **Color**: Green = net buying pressure, Red = net selling pressure
- **Intensity**: Darker colors indicate volume imbalances above threshold
**Key Levels:**
- **POC (Blue Line)**: Highest volume price - major support/resistance
- **VAH (Purple Dashed)**: Value Area High - upper boundary of fair value
- **VAL (Orange Dashed)**: Value Area Low - lower boundary of fair value
- **Value Area Fill**: Shaded region showing main trading range
**Developing POC Trail:**
- **Blue Dotted Lines**: Show real-time POC evolution throughout the session
- **Migration Patterns**: Upward trail indicates bullish accumulation, downward trail suggests bearish distribution
- **Early Signals**: POC movement often precedes price movement, providing advance warning of institutional activity
- **Institutional Footprints**: Reveals where smart money concentrated volume before final POC establishment
### Trading Applications:
**Support/Resistance Analysis:**
- POC acts as magnetic price level - expect reactions
- VAH/VAL provide intermediate support/resistance levels
- Profile edges show areas of low volume acceptance
**Developing POC Analysis:**
- **Upward Migration**: POC moving higher = institutional accumulation, bullish bias
- **Downward Migration**: POC moving lower = institutional distribution, bearish bias
- **Stable POC**: Tight clustering = balanced market, range-bound conditions
- **Early Trend Detection**: POC direction change often precedes price breakouts
**Entry Strategies:**
- Buy at VAL with POC as target (in uptrends)
- Sell at VAH with POC as target (in downtrends)
- Breakout plays above/below profile extremes
**Volume Imbalance Trading:**
- Strong buying imbalance (>60% threshold) suggests continued upward pressure
- Strong selling imbalance suggests continued downward pressure
- Imbalances near key levels provide high-probability setups
**Multi-Timeframe Context:**
- Use higher timeframe profiles for major levels
- Lower timeframe profiles for precise entries
- Session profiles for intraday trading structure
## SCRIPT SETTINGS EXPLANATION
### Volume Profile Settings:
- **Profile Type**: Determines data range for calculation
- N Bars Back: Exact number of bars (20-500 range)
- Days Back: Calendar days with timeframe adaptation (1-365 days)
- Session: Trading session-based (intraday focus)
- **Number of Rows**: Profile resolution (10-50 range)
- **Profile Width**: Visual width as chart percentage (10-50%)
- **Value Area %**: Volume percentage for VA calculation (50-90%, 70% standard)
- **Auto-Adjust**: Automatically optimizes for different timeframes
### Delta Volume Settings:
- **Show Delta Volume**: Enable/disable delta calculations
- **Delta Calculation Method**: Choose methodology based on market conditions
- **Highlight Imbalances**: Visual emphasis for significant volume imbalances
- **Imbalance Threshold**: Percentage for imbalance detection (50-90%)
### Session Settings:
- **Session Type**: Daily, Weekly, Monthly, or Custom periods
- **Custom Session Time**: Define specific trading hours
- **Previous Sessions**: Number of historical sessions to display
### Days Back Settings:
- **Lookback Days**: Number of calendar days to analyze (1-365)
- **Automatic Calculation**: Script automatically converts days to bars based on timeframe:
- Intraday: Accounts for 6.5 trading hours per day
- Daily: 1 bar per day
- Weekly/Monthly: Proportional adjustment
### N Bars Back Settings:
- **Lookback Bars**: Exact number of bars to analyze (20-500)
- **Precise Control**: Best for systematic analysis and backtesting
### Visual Customization:
- **Colors**: Bullish (green), Bearish (red), and level colors
- **Profile Position**: Left or Right side of chart
- **Profile Offset**: Distance from current price action
- **Labels**: Show/hide level labels and values
- **Smooth Profile Bars**: Enhanced visual appearance
### Alert Configuration:
- **POC Touch**: Alerts when price interacts with Point of Control
- **VA Entry/Exit**: Alerts for Value Area boundary interactions
- **Major Imbalance**: Alerts for significant volume imbalances
## VISUAL FEATURES
### Profile Display:
- **Horizontal Bars**: Volume distribution across price levels
- **Color Coding**: Delta-based coloring for directional bias
- **Smooth Rendering**: Optional smoothing for cleaner appearance
- **Transparency**: Configurable opacity for chart readability
### Level Lines:
- **POC**: Solid blue line with optional label
- **VAH/VAL**: Dashed colored lines with value displays
- **Extension**: Lines extend across relevant time periods
- **Value Area Fill**: Optional shaded region between VAH/VAL
### Information Table:
- **Current Values**: Real-time POC, VAH, VAL prices
- **VA Range**: Value Area width calculation
- **Positioning**: Multiple table positions available
- **Text Sizing**: Adjustable for different screen sizes
## IMPORTANT USAGE NOTES
**Realistic Expectations:**
- Volume profile analysis provides structural context, not trading signals
- Delta calculations are estimations based on price action, not actual order flow
- Past volume distribution does not guarantee future price behavior
- Combine with other analysis methods for comprehensive market view
**Best Practices:**
- Use appropriate profile types for your trading style:
- Day Trading: Session or Days Back (1-5 days)
- Swing Trading: Days Back (10-30 days) or N Bars Back
- Position Trading: Days Back (60-180 days)
- Consider market context (trending vs ranging conditions)
- Verify key levels with additional technical analysis
- Monitor profile development for changing market structure
**Performance Considerations:**
- Higher row counts increase calculation complexity
- Large lookback periods may affect chart performance
- Auto-adjust feature optimizes for most use cases
- Consider using session profiles for intraday efficiency
**Limitations:**
- Delta calculations are estimations, not actual transaction data
- Profile accuracy depends on available price/volume history
- Effectiveness varies across different instruments and market conditions
- Requires understanding of volume profile concepts for optimal use
**Data Requirements:**
- Requires volume data for accurate calculations
- Works best on liquid instruments with consistent volume
- May be less effective on very low volume or exotic instruments
This script serves as a comprehensive volume analysis tool for traders who need detailed market structure information with integrated directional bias analysis and real-time POC development tracking for informed trading decisions.

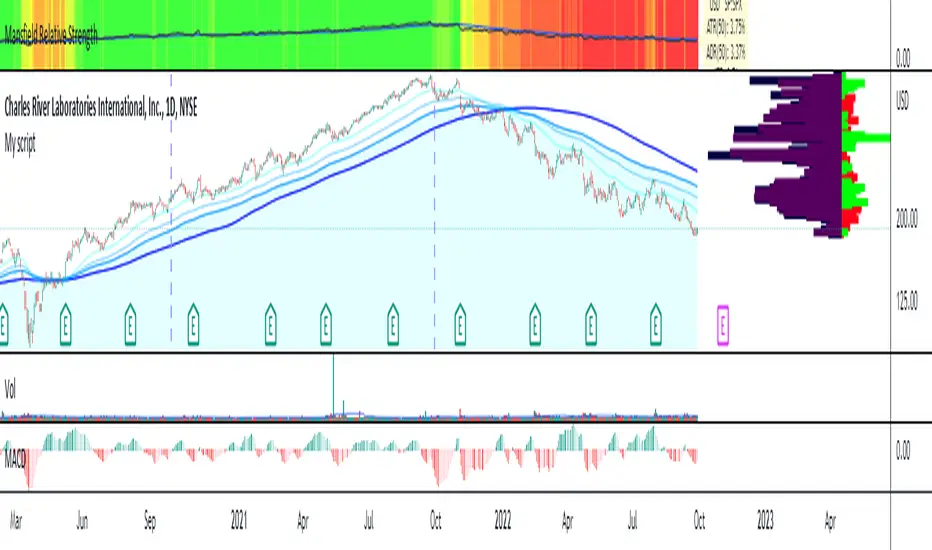
Delta Volume Profile [BigBeluga]🔵Delta Volume Profile
A dynamic volume analysis tool that builds two separate horizontal profiles: one for bullish candles and one for bearish candles. This indicator helps traders identify the true balance of buying vs. selling volume across price levels, highlighting points of control (POCs), delta dominance, and hidden volume clusters with remarkable precision.
🔵 KEY FEATURES
Split Volume Profiles (Bull vs. Bear):
The indicator separates volume based on candle direction:
If close > open , the candle’s volume is added to the bullish profile (positive volume).
If close < open , it contributes to the bearish profile (negative volume).
ATR-Based Binning:
The price range over the selected lookback is split into bins using ATR(200) as the bin height.
Each bin accumulates both bull and bear volumes to form the dual-sided profile.
Bull and Bear Volume Bars:
Bullish volumes are shown as right-facing bars on the right side, colored with a bullish gradient.
Bearish volumes appear as left-facing bars on the left side, shaded with a bearish gradient.
Each bar includes a volume label (e.g., +12.45K or -9.33K) to show exact volume at that price level.
Points of Control (POC) Highlighting:
The bin with the highest bullish volume is marked with a border in POC+ color (default: blue).
The bin with the highest bearish volume is marked with a POC− color (default: orange).
Total Volume Density Map:
A neutral gray background box is plotted behind candles showing the total volume (bull + bear) per bin.
This reveals high-interest price zones regardless of direction.
Delta and Total Volume Summary:
A Delta label appears at the top, showing net % difference between bull and bear volume.
A Total label at the bottom shows total accumulated volume across all bins.
🔵 HOW IT WORKS
The indicator captures all candles within the lookback period .
It calculates the price range and splits it into bins using ATR for adaptive resolution.
For each candle:
If price intersects a bin and close > open , volume is added to the positive profile .
If close < open , volume is added to the negative profile .
The result is two side-by-side histograms at each price level—one for buyers, one for sellers.
The bin with the highest value on each side is visually emphasized using POC highlight colors.
At the end, the script calculates:
Delta: Total % difference between bull and bear volumes.
Total: Sum of all volumes in the lookback window.
🔵 USAGE
Volume Imbalance Zones: Identify price levels where buyers or sellers were clearly dominant.
Fade or Follow Volume Clusters: Use POC+ or POC− levels for reaction trades or breakouts.
Delta Strength Filtering: Strong delta values (> ±20%) suggest momentum or exhaustion setups.
Volume-Based Anchoring: Use profile levels to mark hidden support/resistance and execution zones.
🔵 CONCLUSION
Delta Volume Profile offers a unique advantage in market reading by separating buyer and seller activity into two visual layers. This allows traders to not only spot where volume was high, but also who was more aggressive. Whether you’re analyzing trend continuations, reversals, or absorption levels, this indicator gives you the transparency needed to trade with confidence.

VolumeProfileLibrary "VolumeProfile"
Analyzes volume and price and calculates a volume profile, in particular the Point Of Control and Value Area values.
new(rowSizeInTicks, valueAreaCoverage, startTime)
Constructor method that creates a new Volume Profile
Parameters:
rowSizeInTicks (float) : Internal row size (aka resolution) of the volume profile. Useful for most futures contracts would be '1 / syminfo.mintick'. Default '4'.
valueAreaCoverage (int) : Percentage of total volume that is considered the Value Area. Default '70'
startTime (int) : Start time (unix timestamp in milliseconds) of the Volume Profile. Default 'time'.
Returns: VolumeProfile object
method calculatePOC(vp)
Calculates current Point Of Control of the VP
Namespace types: VolumeProfile
Parameters:
vp (VolumeProfile)
Returns: void
method calculateVA(vp)
Calculates current Value Area High and Low of the VP
Namespace types: VolumeProfile
Parameters:
vp (VolumeProfile)
Returns: void
method update(vp, h, l, v, t)
Processes new chart data and sorts volume into rows. Then calls calculatePOC() and calculateVA() to update the VP. Parameters are usually the output of request.security_lower_tf.
Namespace types: VolumeProfile
Parameters:
vp (VolumeProfile)
h (array) : Array of highs
l (array) : Array of lows
v (array) : Array of volumes
t (array) : Array of candle times
Returns: void
method setSessionHigh(vp, h)
Sets the high of the session the VP is tracking
Namespace types: VolumeProfile
Parameters:
vp (VolumeProfile)
h (float)
Returns: void
method setSessionLow(vp, l)
Sets the low of the session the VP is tracking
Namespace types: VolumeProfile
Parameters:
vp (VolumeProfile)
l (float)
Returns: void
method getPOC(vp)
Gets the current Point Of Control
Namespace types: VolumeProfile
Parameters:
vp (VolumeProfile)
Returns: Point Of Control (float)
method getVAH(vp)
Gets the current Value Area High
Namespace types: VolumeProfile
Parameters:
vp (VolumeProfile)
Returns: Value Area High (float)
method getVAL(vp)
Gets the current Value Area Low
Namespace types: VolumeProfile
Parameters:
vp (VolumeProfile)
Returns: Value Area Low (float)
VolumeProfile
Fields:
rowSizeInTicks (series float)
valueAreaCoverage (series int)
startTime (series int)
valueAreaHigh (series float)
pointOfControl (series float)
valueAreaLow (series float)
sessionHigh (series float)
sessionLow (series float)
volumeByRow (map)
totalVolume (series float)
pocRow (series float)
pocVol (series float)

SessionVolumeProfileLibrary "SessionVolumeProfile"
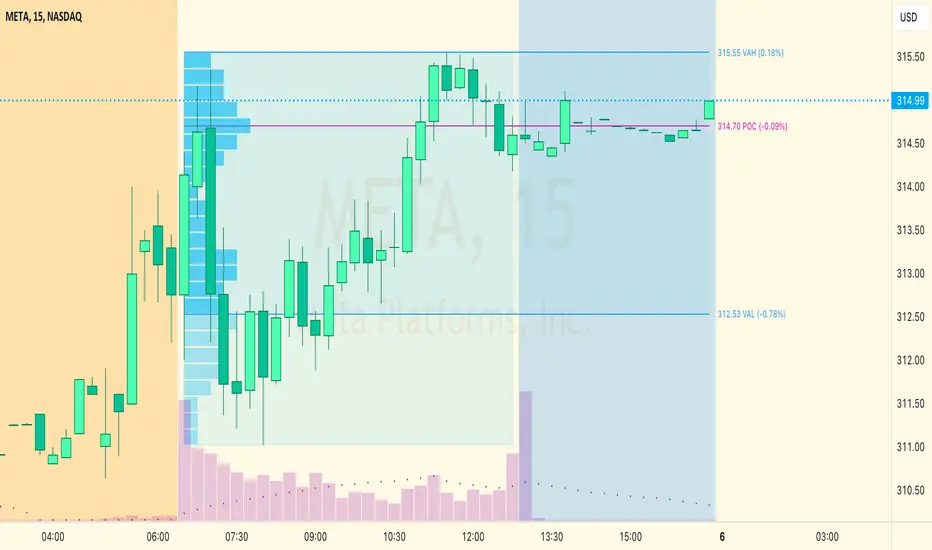
Analyzes price & volume during regular trading hours to provide a session volume profile analysis. The primary goal of this library is to provide the developer with three values: the value area high, low and the point of control. The library also provides methods for rendering the value areas and histograms. To learn more about this library and how you can use it, click on the website link in my profile where you will find a blog post with detailed information.
debug(vp, position)
Helper function to write some information about the supplied SVP object to the screen in a table.
Parameters:
vp (Object) : The SVP object to debug
position (string) : The position.* to place the table. Defaults to position.bottom_center
getLowerTimeframe()
Depending on the timeframe of the chart, determines a lower timeframe to grab volume data from for the analysis
Returns: The timeframe string to fetch volume for
get(volumeProfile, lowerTimeframeHigh, lowerTimeframeLow, lowerTimeframeVolume)
Populated the provided SessionVolumeProfile object with vp data on the session.
Parameters:
volumeProfile (Object) : The SessionVolumeProfile object to populate
lowerTimeframeHigh (float ) : The lower timeframe high values
lowerTimeframeLow (float ) : The lower timeframe low values
lowerTimeframeVolume (float ) : The lower timeframe volume values
drawPriorValueAreas(todaySessionVolumeProfile, extendYesterdayOverToday, showLabels, labelSize, pocColor, pocStyle, pocWidth, vahlColor, vahlStyle, vahlWidth, vaColor)
Given a SessionVolumeProfile Object, will render the historical value areas for that object.
Parameters:
todaySessionVolumeProfile (Object) : The SessionVolumeProfile Object to draw
extendYesterdayOverToday (bool) : Defaults to true
showLabels (bool) : Defaults to true
labelSize (string) : Defaults to size.small
pocColor (color) : Defaults to #e500a4
pocStyle (string) : Defaults to line.style_solid
pocWidth (int) : Defaults to 1
vahlColor (color) : The color of the value area high/low lines. Defaults to #1592e6
vahlStyle (string) : The style of the value area high/low lines. Defaults to line.style_solid
vahlWidth (int) : The width of the value area high/low lines. Defaults to 1
vaColor (color) : The color of the value area background. Defaults to #00bbf911)
drawHistogram(volumeProfile, bgColor, showVolumeOnHistogram)
Given a SessionVolumeProfile object, will render the histogram for that object.
Parameters:
volumeProfile (Object) : The SessionVolumeProfile object to draw
bgColor (color) : The baseline color to use for the histogram. Defaults to #00bbf9
showVolumeOnHistogram (bool) : Show the volume amount on the histogram bars. Defaults to false.
Object
Fields:
numberOfRows (series__integer)
valueAreaCoverage (series__integer)
trackDevelopingVa (series__bool)
valueAreaHigh (series__float)
pointOfControl (series__float)
valueAreaLow (series__float)
startTime (series__integer)
endTime (series__integer)
dayHigh (series__float)
dayLow (series__float)
step (series__float)
pointOfControlLevel (series__integer)
valueAreaHighLevel (series__integer)
valueAreaLowLevel (series__integer)
volumeRows (array__float)
priceLevelRows (array__float)
ltfSessionHighs (array__float)
ltfSessionLows (array__float)
ltfSessionVols (array__float)