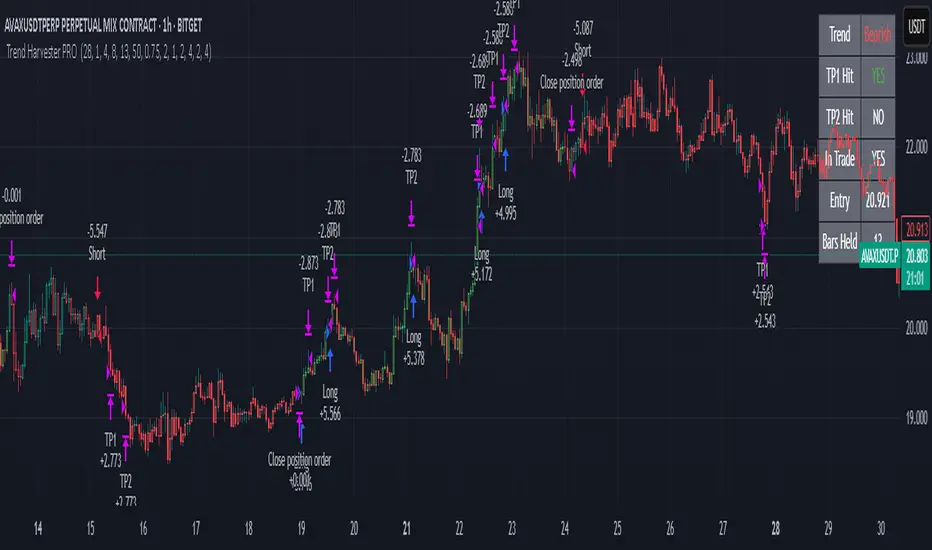
Trend Harvester PRO Trend Harvester PRO – Adaptive Trend-Following Strategy for Crypto
Trend Harvester PRO is a fully systematic trend-following strategy built for cryptocurrency markets on intraday timeframes — particularly optimized for the 1-hour chart. The script combines ZLEMA-based trend tracking, momentum confirmation, and a volatility-aware filter to detect high-probability directional moves with clarity and precision.
This is not a mashup of random indicators — each component serves a specific purpose in validating trends, avoiding choppy zones, and timing entries responsibly.
🔍 Strategy Logic Overview
The core objective is to detect sustainable, real-time trends and exit with multi-stage profit targets. To do this, the script uses several layers of confirmation:
1. 📊 ZLEMA Trend Engine (Zero Lag EMA)
This is the backbone of the strategy.
ZLEMA (Zero-Lag EMA) is a moving average that minimizes lag by adjusting for past data offset.
The strategy uses a fast ZLEMA and a slow ZLEMA, combined with a slope calculation, to assess the current trend.
When:
Fast ZLEMA > Slow ZLEMA
The ZLEMA is rising (positive slope)
→ The market is considered in an uptrend.
Conversely, if:
Fast ZLEMA < Slow ZLEMA
The slope is negative
→ The market is considered in a downtrend.
This setup detects not just direction, but also whether the trend has meaningful acceleration.
2. ⚡ Momentum Confirmation
Trend direction alone isn’t enough — we also need momentum agreement.
The script calculates a smoothed Rate of Change (ROC) to evaluate if momentum supports the direction of the ZLEMA trend.
For long trades: ROC must be positive
For short trades: ROC must be negative
This prevents taking trades where price is crossing moving averages but lacks follow-through power.
3. 🌪️ Volatility Filter
Choppy markets are common in crypto. To reduce false signals:
The script compares short-term volatility (10-bar standard deviation of price changes) to longer-term volatility.
If the ratio is too high (i.e., short-term volatility is spiking), the strategy avoids entry.
This ensures trades are only taken when the market is relatively calm and directional — avoiding false breakouts.
4. 🧠 Confirmation Bars + Trend State
Signals only trigger after a certain number of consecutive bars confirm trend direction (confirmBars).
This prevents reacting to just 1 candle and requires consistent evidence of trend.
A state machine is used to track current trend status:
+1 = confirmed uptrend
-1 = confirmed downtrend
0 = neutral / no trade
This trend state changes only after all conditions are met and confirmation bars pass.
5. 🧊 Cooldown Enforcement
After a trade exits (from TP or a trend reversal), the strategy enforces a cooldown period before new entries are allowed. This:
Prevents back-to-back entries on trend flips
Reduces overtrading
Helps avoid whipsaws or same-bar reversal trades
6. 🎯 Multi-Level Take Profits (TP1 & TP2)
Once a trade is entered:
Two limit exits are set automatically:
TP1: Closes 50% of the position at a configurable profit level
TP2: Closes the remaining 50%
If the trend weakens before TP2 is reached, the position is closed early.
Both long and short trades use the same logic, with user-defined percentages.
This system allows for partial profit-taking while keeping a portion of the trade running.
7. 🧾 Built-in Dashboard
The script includes a real-time dashboard showing:
Trend direction: Bullish, Bearish, or Neutral
Whether TP1 / TP2 was hit
Entry price
If currently in a trade
How many bars the trade has been open
This helps monitor strategy performance at a glance without needing extra labels.
8. 🔔 Webhook-Compatible Alerts
The strategy includes custom alerts that can be used for:
Long and Short entries
TP1 and TP2 hits
Exiting trades
These can be integrated into automated bot systems or used manually.
🔒 Non-Repainting Logic
The strategy uses only confirmed bar data (i.e., values from closed bars).
There are no repainting indicators.
Entries and exits are placed using strategy.entry and strategy.exit on confirmed conditions.
✅ How to Use It
Apply the strategy to 1H altcoin charts (BTC, ETH, SOL, etc.).
Tune the TP percentages (longTP1Pct, longTP2Pct, etc.) based on volatility.
Use the dashboard to monitor trend state and trade progress.
Combine with additional tools (like support/resistance or volume) for higher confluence.
Use the date filter to run backtests over defined periods.
⚠️ Risk Management Notice
This strategy does not include stop losses by default. It is designed to exit based on trend reversal or take-profit limits.
Always backtest thoroughly and use realistic sizing.
Do not risk more than 5–10% of your account on any trade.
Past results do not guarantee future performance. This tool is for educational and research purposes.
🧬 What Makes This Original
Trend Harvester PRO was built from scratch with tightly integrated logic:
ZLEMA tracks early trend direction with low lag
ROC confirms momentum in the same direction
Volatility filter avoids false setups
Multi-bar confirmation and cooldown logic control trade pacing
Dual TP exits manage partial profit-taking
A live dashboard makes real-time tracking intuitive
Unlike mashups of indicators with no synergy, each component here directly supports the quality of trade decisions, and the logic is modular, transparent, and non-repainting.
成交量
Liquid Pulse Liquid Pulse by Dskyz (DAFE) Trading Systems
Liquid Pulse is a trading algo built by Dskyz (DAFE) Trading Systems for futures markets like NQ1!, designed to snag high-probability trades with tight risk control. it fuses a confluence system—VWAP, MACD, ADX, volume, and liquidity sweeps—with a trade scoring setup, daily limits, and VIX pauses to dodge wild volatility. visuals include simple signals, VWAP bands, and a dashboard with stats.
Core Components for Liquid Pulse
Volume Sensitivity (volumeSensitivity) controls how much volume spikes matter for entries. options: 'Low', 'Medium', 'High' default: 'High' (catches small spikes, good for active markets) tweak it: 'Low' for calm markets, 'High' for chaos.
MACD Speed (macdSpeed) sets the MACD’s pace for momentum. options: 'Fast', 'Medium', 'Slow' default: 'Medium' (solid balance) tweak it: 'Fast' for scalping, 'Slow' for swings.
Daily Trade Limit (dailyTradeLimit) caps trades per day to keep risk in check. range: 1 to 30 default: 20 tweak it: 5-10 for safety, 20-30 for action.
Number of Contracts (numContracts) sets position size. range: 1 to 20 default: 4 tweak it: up for big accounts, down for small.
VIX Pause Level (vixPauseLevel) stops trading if VIX gets too hot. range: 10 to 80 default: 39.0 tweak it: 30 to avoid volatility, 50 to ride it.
Min Confluence Conditions (minConditions) sets how many signals must align. range: 1 to 5 default: 2 tweak it: 3-4 for strict, 1-2 for more trades.
Min Trade Score (Longs/Shorts) (minTradeScoreLongs/minTradeScoreShorts) filters trade quality. longs range: 0 to 100 default: 73 shorts range: 0 to 100 default: 75 tweak it: 80-90 for quality, 60-70 for volume.
Liquidity Sweep Strength (sweepStrength) gauges breakouts. range: 0.1 to 1.0 default: 0.5 tweak it: 0.7-1.0 for strong moves, 0.3-0.5 for small.
ADX Trend Threshold (adxTrendThreshold) confirms trends. range: 10 to 100 default: 41 tweak it: 40-50 for trends, 30-35 for weak ones.
ADX Chop Threshold (adxChopThreshold) avoids chop. range: 5 to 50 default: 20 tweak it: 15-20 to dodge chop, 25-30 to loosen.
VWAP Timeframe (vwapTimeframe) sets VWAP period. options: '15', '30', '60', '240', 'D' default: '60' (1-hour) tweak it: 60 for day, 240 for swing, D for long.
Take Profit Ticks (Longs/Shorts) (takeProfitTicksLongs/takeProfitTicksShorts) sets profit targets. longs range: 5 to 100 default: 25.0 shorts range: 5 to 100 default: 20.0 tweak it: 30-50 for trends, 10-20 for chop.
Max Profit Ticks (maxProfitTicks) caps max gain. range: 10 to 200 default: 60.0 tweak it: 80-100 for big moves, 40-60 for tight.
Min Profit Ticks to Trail (minProfitTicksTrail) triggers trailing. range: 1 to 50 default: 7.0 tweak it: 10-15 for big gains, 5-7 for quick locks.
Trailing Stop Ticks (trailTicks) sets trail distance. range: 1 to 50 default: 5.0 tweak it: 8-10 for room, 3-5 for fast locks.
Trailing Offset Ticks (trailOffsetTicks) sets trail offset. range: 1 to 20 default: 2.0 tweak it: 1-2 for tight, 5-10 for loose.
ATR Period (atrPeriod) measures volatility. range: 5 to 50 default: 9 tweak it: 14-20 for smooth, 5-9 for reactive.
Hardcoded Settings volLookback: 30 ('Low'), 20 ('Medium'), 11 ('High') volThreshold: 1.5 ('Low'), 1.8 ('Medium'), 2 ('High') swingLen: 5
Execution Logic Overview trades trigger when confluence conditions align, entering long or short with set position sizes. exits use dynamic take-profits, trailing stops after a profit threshold, hard stops via ATR, and a time stop after 100 bars.
Features Multi-Signal Confluence: needs VWAP, MACD, volume, sweeps, and ADX to line up.
Risk Control: ATR-based stops (capped 15 ticks), take-profits (scaled by volatility), and trails.
Market Filters: VIX pause, ADX trend/chop checks, volatility gates. Dashboard: shows scores, VIX, ADX, P/L, win %, streak.
Visuals Simple signals (green up triangles for longs, red down for shorts) and VWAP bands with glow. info table (bottom right) with MACD momentum. dashboard (top right) with stats.
Chart and Backtest:
NQ1! futures, 5-minute chart. works best in trending, volatile conditions. tweak inputs for other markets—test thoroughly.
Backtesting: NQ1! Frame: Jan 19, 2025, 09:00 — May 02, 2025, 16:00 Slippage: 3 Commission: $4.60
Fee Typical Range (per side, per contract)
CME Exchange $1.14 – $1.20
Clearing $0.10 – $0.30
NFA Regulatory $0.02
Firm/Broker Commis. $0.25 – $0.80 (retail prop)
TOTAL $1.60 – $2.30 per side
Round Turn: (enter+exit) = $3.20 – $4.60 per contract
Disclaimer this is for education only. past results don’t predict future wins. trading’s risky—only use money you can lose. backtest and validate before going live. (expect moderators to nitpick some random chart symbol rule—i’ll fix and repost if they pull it.)
About the Author Dskyz (DAFE) Trading Systems crafts killer trading algos. Liquid Pulse is pure research and grit, built for smart, bold trading. Use it with discipline. Use it with clarity. Trade smarter. I’ll keep dropping badass strategies ‘til i build a brand or someone signs me up.
2025 Created by Dskyz, powered by DAFE Trading Systems. Trade smart, trade bold.

Shockwave⚡️ Shockwave – Precision Momentum Strategy
🔹 Purpose
Shockwave is a precision-engineered trend and momentum strategy designed for aggressive, high-conviction trades. Built for volatile markets like crypto, this system enters only when trend, volume, and momentum are fully aligned — then exits intelligently using layered profit targets and trend weakening logic.
It filters out false breakouts, traps, and low-quality setups using advanced multi-factor confirmation. Ideal for trend-following traders who want cleaner signals, no repainting, and adaptive position handling.
🔹 Indicator Breakdown
1️⃣ ZLEMA + Gradient Filter (Trend Core)
Defines the trend using a Zero Lag EMA (ZLEMA) for responsiveness.
Gradient slope confirms acceleration or weakening in trend direction.
Uptrend: ZLEMA is rising and slope > 0.
Downtrend: ZLEMA is falling and slope < 0.
2️⃣ Smoothed CCI (Momentum Confirmation)
Uses ZLEMA as the source for CCI to avoid noise.
Bullish momentum: CCI rising above 0.
Bearish momentum: CCI falling below 0.
Filters out chop and premature entries.
3️⃣ Volume Spike Filter
Median-based filter confirms breakout volume integrity.
Requires volume > 1.5x median of previous candles.
Avoids low-volume whipsaws.
4️⃣ Vortex Indicator (Trend Strength Confirmation)
Confirms directional conviction by comparing VI+ vs VI–.
Long: VI+ > VI– and threshold difference is met.
Short: VI– > VI+ and trend strength is validated.
5️⃣ Wick Trap Filter (Reversal Trap Detection)
Blocks entries on manipulative upper/lower wick patterns.
Longs rejected if upper wick > 1.5× body and close is weak.
Shorts rejected if lower wick > 1.5× body and close is strong.
🔹 Strategy Logic & Trade Execution
✅ Entry Conditions
A trade is entered only when all the following align:
ZLEMA trend direction is confirmed.
CCI momentum matches the trend.
Volume spike confirms participation.
Vortex difference meets strength threshold.
No wick trap is present.
✅ Exit Conditions
TP1: 50% of the position is closed at the first profit level.
TP2: Remaining 50% is closed at the second target.
Weak Trend Exit: If ZLEMA slope flips against the trade, the position is closed early.
A 1-bar cooldown delay is enforced after closing to prevent same-bar reentry.
🔹 Take-Profit System
TP1: 50% close at +2% for longs / –2% for shorts
TP2: Full close at +4% for longs / –4% for shorts
Limit orders are used for precise profit-taking
TP1/TP2 status is tracked and displayed in the live dashboard
🔹 Risk Management (Important)
🚫 This strategy does not include a stop-loss by default.
Trades are exited using trend reversal detection or TP targets.
💡 Suggested risk controls:
Add a manual stop-loss based on recent swing high/low
Use appropriate position sizing based on volatility
Apply the strategy in strong trending environments
🔹 Default Backtest Settings
Initial Capital: $1,000
Position Size: 10% of equity per trade
Commission: 0.05%
Slippage: 1
Strategy Date Filter: Adjustable (default: 2023–2029)
🔹 How to Use Shockwave
Apply to any chart (best results on 1H or higher).
Review backtest performance.
Adjust take-profit percentages or thresholds as needed.
Use in strongly trending markets — avoid sideways ranges.
Add your own stop-loss if desired.
⚠️ Disclaimer
This strategy is for educational and informational purposes only. It is not financial advice. Trading involves risk, and past performance does not guarantee future results. Always test thoroughly and manage your own risk.
🚀 Why Use Shockwave?
✔ Multi-layer confirmation for high-quality entries
✔ Non-repainting logic for backtest/live consistency
✔ Adaptive trend/momentum filtering
✔ Dual profit targets for smart trade management
✔ Visual dashboard with live tracking

EXODUS EXODUS by (DAFE) Trading Systems
EXODUS is a sophisticated trading algorithm built by Dskyz (DAFE) Trading Systems for competitive and competition purposes, designed to identify high-probability trades with robust risk management. this strategy leverages a multi-signal voting system, combining three core components—SPR, VWMO, and VEI—alongside ADX, choppiness filters, and ATR-based volatility gates to ensure trades are taken only in favorable market conditions. the algo uses a take-profit to stop-loss ratio, dynamic position sizing, and a strict voting mechanism requiring all signals to align before entering a trade.
EXODUS was not overfitted for any specific symbol. instead, it uses a generic tuned setting, making it versatile across various markets. while it can trade futures, it’s not currently set up for it but has the potential to do more with further development. visuals are intentionally minimal due to its competition focus, prioritizing performance over aesthetics. a more visually stunning version may be released in the future with enhanced graphics.
The Unique Core Components Developed for EXODUS
SPR (Session Price Recalibration)
SPR measures momentum during regular trading hours (RTH, 0930-1600, America/New_York) to catch session-specific trends.
spr_lookback = input.int(15, "SPR Lookback") this sets how many bars back SPR looks to calculate momentum (default 15 bars). it compares the current session’s price-volume score to the score 15 bars ago to gauge momentum strength.
how it works: a longer lookback smooths out the signal, focusing on bigger trends. a shorter one makes SPR more sensitive to recent moves.
how to adjust: on a 1-hour chart, 15 bars is 15 hours (about 2 trading days). if you’re on a shorter timeframe like 5 minutes, 15 bars is just 75 minutes, so you might want to increase it to 50 or 100 to capture more meaningful trends. if you’re trading a choppy stock, a shorter lookback (like 5) can help catch quick moves, but it might give more false signals.
spr_threshold = input.float (0.7, "SPR Threshold")
this is the cutoff for SPR to vote for a trade (default 0.7). if SPR’s normalized value is above 0.7, it votes for a long; below -0.7, it votes for a short.
how it works: SPR normalizes its momentum score by ATR, so this threshold ensures only strong moves count. a higher threshold means fewer trades but higher conviction.
how to adjust: if you’re getting too few trades, lower it to 0.5 to let more signals through. if you’re seeing too many false entries, raise it to 1.0 for stricter filtering. test on your chart to find a balance.
spr_atr_length = input.int(21, "SPR ATR Length") this sets the ATR period (default 21 bars) used to normalize SPR’s momentum score. ATR measures volatility, so this makes SPR’s signal relative to market conditions.
how it works: a longer ATR period (like 21) smooths out volatility, making SPR less jumpy. a shorter one makes it more reactive.
how to adjust: if you’re trading a volatile stock like TSLA, a longer period (30 or 50) can help avoid noise. for a calmer stock, try 10 to make SPR more responsive. match this to your timeframe—shorter timeframes might need a shorter ATR.
rth_session = input.session("0930-1600","SPR: RTH Sess.") rth_timezone = "America/New_York" this defines the session SPR uses (0930-1600, New York time). SPR only calculates momentum during these hours to focus on RTH activity.
how it works: it ignores pre-market or after-hours noise, ensuring SPR captures the main market action.
how to adjust: if you trade a different session (like London hours, 0300-1200 EST), change the session to match. you can also adjust the timezone if you’re in a different region, like "Europe/London". just make sure your chart’s timezone aligns with this setting.
VWMO (Volume-Weighted Momentum Oscillator)
VWMO measures momentum weighted by volume to spot sustained, high-conviction moves.
vwmo_momlen = input.int(21, "VWMO Momentum Length") this sets how many bars back VWMO looks to calculate price momentum (default 21 bars). it takes the price change (close minus close 21 bars ago).
how it works: a longer period captures bigger trends, while a shorter one reacts to recent swings.
how to adjust: on a daily chart, 21 bars is about a month—good for trend trading. on a 5-minute chart, it’s just 105 minutes, so you might bump it to 50 or 100 for more meaningful moves. if you want faster signals, drop it to 10, but expect more noise.
vwmo_volback = input.int(30, "VWMO Volume Lookback") this sets the period for calculating average volume (default 30 bars). VWMO weights momentum by volume divided by this average.
how it works: it compares current volume to the average to see if a move has strong participation. a longer lookback smooths the average, while a shorter one makes it more sensitive.
how to adjust: for stocks with spiky volume (like NVDA on earnings), a longer lookback (50 or 100) avoids overreacting to one-off spikes. for steady volume stocks, try 20. match this to your timeframe—shorter timeframes might need a shorter lookback.
vwmo_smooth = input.int(9, "VWMO Smoothing")
this sets the SMA period to smooth VWMO’s raw momentum (default 9 bars).
how it works: smoothing reduces noise in the signal, making VWMO more reliable for voting. a longer smoothing period cuts more noise but adds lag.
how to adjust: if VWMO is too jumpy (lots of false votes), increase to 15. if it’s too slow and missing trades, drop to 5. test on your chart to see what keeps the signal clean but responsive.
vwmo_threshold = input.float(10, "VWMO Threshold") this is the cutoff for VWMO to vote for a trade (default 10). above 10, it votes for a long; below -10, a short.
how it works: it ensures only strong momentum signals count. a higher threshold means fewer but stronger trades.
how to adjust: if you want more trades, lower it to 5. if you’re getting too many weak signals, raise it to 15. this depends on your market—volatile stocks might need a higher threshold to filter noise.
VEI (Velocity Efficiency Index)
VEI measures market efficiency and velocity to filter out choppy moves and focus on strong trends.
vei_eflen = input.int(14, "VEI Efficiency Smoothing") this sets the EMA period for smoothing VEI’s efficiency calc (bar range / volume, default 14 bars).
how it works: efficiency is how much price moves per unit of volume. smoothing it with an EMA reduces noise, focusing on consistent efficiency. a longer period smooths more but adds lag.
how to adjust: for choppy markets, increase to 20 to filter out noise. for faster markets, drop to 10 for quicker signals. this should match your timeframe—shorter timeframes might need a shorter period.
vei_momlen = input.int(8, "VEI Momentum Length") this sets how many bars back VEI looks to calculate momentum in efficiency (default 8 bars).
how it works: it measures the change in smoothed efficiency over 8 bars, then adjusts for inertia (volume-to-range). a longer period captures bigger shifts, while a shorter one reacts faster.
how to adjust: if VEI is missing quick reversals, drop to 5. if it’s too noisy, raise to 12. test on your chart to see what catches the right moves without too many false signals.
vei_threshold = input.float(4.5, "VEI Threshold") this is the cutoff for VEI to vote for a trade (default 4.5). above 4.5, it votes for a long; below -4.5, a short.
how it works: it ensures only strong, efficient moves count. a higher threshold means fewer trades but higher quality.
how to adjust: if you’re not getting enough trades, lower to 3. if you’re seeing too many false entries, raise to 6. this depends on your market—fast stocks like NQ1 might need a lower threshold.
Features
Multi-Signal Voting: requires all three signals (SPR, VWMO, VEI) to align for a trade, ensuring high-probability setups.
Risk Management: uses ATR-based stops (2.1x) and take-profits (4.1x), with dynamic position sizing based on a risk percentage (default 0.4%).
Market Filters: ADX (default 27) ensures trending conditions, choppiness index (default 54.5) avoids sideways markets, and ATR expansion (default 1.12) confirms volatility.
Dashboard: provides real-time stats like SPR, VWMO, VEI values, net P/L, win rate, and streak, with a clean, functional design.
Visuals
EXODUS prioritizes performance over visuals, as it was built for competitive and competition purposes. entry/exit signals are marked with simple labels and shapes, and a basic heatmap highlights market regimes. a more visually stunning update may be released later, with enhanced graphics and overlays.
Usage
EXODUS is designed for stocks and ETFs but can be adapted for futures with adjustments. it performs best in trending markets with sufficient volatility, as confirmed by its generic tuning across symbols like TSLA, AMD, NVDA, and NQ1. adjust inputs like SPR threshold, VWMO smoothing, or VEI momentum length to suit specific assets or timeframes.
Setting I used: (Again, these are a generic setting, each security needs to be fine tuned)
SPR LB = 19 SPR TH = 0.5 SPR ATR L= 21 SPR RTH Sess: 9:30 – 16:00
VWMO L = 21 VWMO LB = 18 VWMO S = 6 VWMO T = 8
VEI ES = 14 VEI ML = 21 VEI T = 4
R % = 0.4
ATR L = 21 ATR M (S) =1.1 TP Multi = 2.1 ATR min mult = 0.8 ATR Expansion = 1.02
ADX L = 21 Min ADX = 25
Choppiness Index = 14 Chop. Max T = 55.5
Backtesting: TSLA
Frame: Jan 02, 2018, 08:00 — May 01, 2025, 09:00
Slippage: 3
Commission .01
Disclaimer
this strategy is for educational purposes. past performance is not indicative of future results. trading involves significant risk, and you should only trade with capital you can afford to lose. always backtest and validate any strategy before using it in live markets.
(This publishing will most likely be taken down do to some miscellaneous rule about properly displaying charting symbols, or whatever. Once I've identified what part of the publishing they want to pick on, I'll adjust and repost.)
About the Author
Dskyz (DAFE) Trading Systems is dedicated to building high-performance trading algorithms. EXODUS is a product of rigorous research and development, aimed at delivering consistent, and data-driven trading solutions.
Use it with discipline. Use it with clarity. Trade smarter.
**I will continue to release incredible strategies and indicators until I turn this into a brand or until someone offers me a contract.
2025 Created by Dskyz, powered by DAFE Trading Systems. Trade smart, trade bold.

Prime Trend ReactorIntroduction
Prime Trend Reactor is an advanced crypto trend-following strategy designed to deliver precision entries and exits based on a multi-factor trend consensus system.
It combines price action, adaptive moving averages, momentum oscillators, volume analysis, volatility signals, and higher timeframe trend confirmation into a non-repainting, fully systematic approach.
This strategy is original: it builds a unique trend detection matrix by blending multiple forms of price-derived signals through weighted scoring, rather than simply stacking indicators.
It is not a mashup of public indicators — it is engineered from the ground up using custom formulas and strict non-repainting design.
It is optimized for 1-hour crypto charts but can be used across any asset or timeframe.
⚙️ Core Components
Prime Trend Reactor integrates the following custom components:
1. Moving Averages System
Fast EMA (8), Medium EMA (21), Slow EMA (50), Trend EMA (200).
Detects short-term, medium-term, and long-term trend structures.
EMA alignment is scored as part of the trend consensus system.
2. Momentum Oscillators
RSI (Relative Strength Index) with Smoothing.
RMI (Relative Momentum Index) custom-calculated.
Confirms price momentum behavior aligned with trend.
3. Volume Analysis
CMF (Chaikin Money Flow) for accumulation/distribution pressure.
OBV (On Balance Volume) EMA Cross for volume flow confirmation.
4. Volatility and Price Structure
Vortex Indicator (VI+ and VI-) for trend strength and directional bias.
Mean-Extreme Price Engine blends closing price with extremes (high/low) based on user-defined ratio.
5. Structure Breakout Detection
Detects structure breaks based on highest high/lowest low pivots.
Adds weight to trend strength on fresh breakouts.
6. Higher Timeframe Confirmation (HTF)
Uses higher timeframe EMAs and close to confirm macro-trend direction.
Smartly pulls HTF data with barmerge.lookahead_off to avoid repainting.
🔥 Entry and Exit Logic
Long Entry: Triggered when multi-factor trend consensus turns strongly bullish.
Short Entry: Triggered when consensus flips strongly bearish.
Take Profits (TP1/TP2):
TP1: Partial 50% profit at small target.
TP2: Full 100% close at larger target.
Exit on Trend Reversal:
If trend consensus reverses before hitting TP2, the strategy exits early to protect capital.
TP Hits and Trend Reversals fire real-time webhook-compatible alerts.
🧩 Trend Consensus Matrix (Original Concept)
Instead of relying on a single indicator, Prime Trend Reactor calculates a weighted score using:
EMA Alignment
Momentum Oscillators (RSI + RMI)
Volume Analysis
Volatility (Vortex)
Higher Timeframe Bias
Each component adds a weighted contribution to the final trend strength score.
Only when the weighted score exceeds a user-defined threshold does the system allow entries.
This multi-dimensional scoring system is original and engineered specifically to avoid noisy or lagging traditional signals.
📈 Visualization and Dashboard
Custom EMA Clouds dynamically fill between Fast/Medium EMAs.
Colored Candles show real-time trend direction.
Dynamic Dashboard displays:
Current Position (Long/Short/Flat)
Entry Price
TP1 and TP2 Hit Status
Bars Since Entry
Win Rate (%)
Profit Factor
Current Trend Signal
Consensus Score (%)
🛡️ Non-Repainting Design
All trend calculations are based on current and confirmed past data.
HTF confirmations use barmerge.lookahead_off.
No same-bar entries and exits — enforced logic prevents overlap.
No lookahead bias.
Strict variable handling ensures confirmed-only trend state transitions.
✅ 100% TradingView-approved non-repainting behavior.
📣 Alerts and Webhooks
This strategy includes full TradingView webhook support:
Long/Short Entries
TP1 Hit (Partial Exit)
TP2 Hit (Full Exit)
Exit on Trend Reversal
All alerts use constant-string JSON formatting compliant with TradingView multi-exchange bots:
📜 TradingView Mandatory Disclaimer
This strategy is a tool to assist in market analysis. It does not guarantee profitability. Trading financial markets involves risk. You are solely responsible for your trading decisions. Past performance does not guarantee future results.

Sniper Core XT🔫 SNIPER CORE XT — ZLEMA-Based Trend + Momentum Strategy for Crypto
⚙️ How It Works (What Makes It Unique):
Sniper Core XT is a fully automated, non-repainting crypto strategy that combines a purpose-built trend detection system with volatility, volume, and momentum confirmation. It is designed from scratch in Pine Script v5 and optimized for bot deployment, copy trading, or semi-manual execution on the 1H timeframe.
Unlike a simple indicator mashup, this strategy builds its logic around one core component — ZLEMA (Zero-Lag Exponential Moving Average) — and then selectively adds only supporting filters that refine trend detection and execution logic.
🧠 Core Logic & Components:
ZLEMA Trend Engine:
The main trend signal comes from a fast vs. slow ZLEMA crossover. ZLEMA is chosen for its responsiveness and minimal lag, giving traders earlier entries without the noise of standard EMAs.
Vortex Direction & Strength Filter:
Uses Vortex Indicator internals to measure directional conviction. The strategy only enters if the vortex aligns with ZLEMA direction and shows minimum strength based on a customizable threshold.
Volume Confirmation via ZLEMA of Volume:
Filters out weak moves by confirming that current volume exceeds the ZLEMA-smoothed average of volume, creating adaptive volume thresholds.
Adaptive Momentum Filter:
Momentum is measured by a normalized rate-of-change adjusted for volatility (ATR). This helps avoid flat market entries and overextends.
Hardcoded Stop Loss (2%) and Dual TP:
TP1: 50% profit scale-out
TP2: Full closure
Stop loss exits on bar close, not using built-in SL/TP orders — this allows reentry if conditions remain favorable.
Real-Time Non-Canvas Dashboard:
A lightweight table shows entry price, trend direction, TP1/TP2/SL hit status, and bars in trade — all configurable for screen position and font size.
One-Bar Cooldown Mechanism:
Prevents entering and exiting on the same bar. Reinforces realistic execution logic and avoids repaint artifacts.
🧪 Strategy Use & Applications:
Designed for 1H trading of trending crypto pairs
Works well in medium-to-high volatility conditions
Fully supports multi-exchange alerts for integration with:
WunderTrading
3Commas
Cornix
PineConnector
🛡️ Strategy Style:
Feature Value
Repainting ❌ Never
Entry Cooldown ✅ 1-Bar
SL Handling ✅ 2% from entry (hardcoded)
TP1/TP2 ✅ Built-in (limit orders)
Alert Compatible ✅ Fully supported
Timeframe 🕒 1H recommended
⚠️ Disclaimer:
This is not financial advice. All signals are based on historical logic and may differ in live markets. Always use proper position sizing and risk management.
📌 Publishing Notes
This strategy is original and built from scratch. While it uses ZLEMA and Vortex as components, all logic — including volume filters, momentum filters, TP/SL logic, and dashboard — has been custom-coded and tested specifically for crypto trend-following on the 1H timeframe.

AccumulationPro Money Flow StrategyAccumulationPro Money Flow Strategy identifies stock trading opportunities by analyzing money flow and potential long-only opportunities following periods of increased money inflow. It employs proprietary responsive indicators and oscillators to gauge the strength and momentum of the inflow relative to previous periods, detecting money inflow, buying/selling pressure, and potential continuation/reversals, while using trailing stop exits to maximize gains while minimizing losses, with careful consideration of risk management and position sizing.
Setup Instructions:
1. Configuring the Strategy Properties:
Click the "Settings" icon (the gear symbol) next to the strategy name.
Navigate to the "Properties" tab within the Settings window.
Initial Capital: This value sets the starting equity for the strategy backtesting. Keep in mind that you will need to specify your current account size in the "Inputs" settings for position sizing.
Base Currency: Leave this setting at its "Default" value.
Order Size: This setting, which determines the capital used for each trade during backtesting, is automatically calculated and updated by the script. You should leave it set to "1 Contract" and the script will calculate the appropriate number of contracts based on your risk per trade, account size, and stop-loss placement.
Pyramiding: Set this setting at 1 order to prevent the strategy from adding to existing positions.
Commission: Enter your broker's commission fee per trade as a percentage, some brokers might offer commission free trading. Verify Price for limit orders: Keep this value as 0 ticks.
Slippage: This value depends on the instrument you are trading, If you are trading liquid stocks on a 1D chart slippage might be neglected. You can Keep this value as 1 ticks if you want to be conservative.
Margin for long positions/short positions: Set both of these to 100% since this strategy does not employ leverage or margin trading.
Recalculate:
Select the "After order is filled" option.
Select the "On every tick" option.
Fill Orders: Keep “Using bar magnifier” unselected.
Select "On bar close". Select "Using standard OHLC"
2. Configuring the Strategy Inputs:
Click the "Inputs" tab in the Settings window.
From/Thru (Date Range): To effectively backtest the strategy, define a substantial period that includes various bullish and bearish cycles. This ensures the testing window captures a range of market conditions and provides an adequate number of trades. It is usually favorable to use a minimum of 8 years for backtesting. Ensure the "Show Date Range" box is checked.
Account Size: This is your actual current Account Size used in the position sizing table calculations.
Risk on Capital %: This setting allows you to specify the percentage of your capital you are willing to risk on each trade. A common value is 0.5%.
3. Configuring Strategy Style:
Select the "Style" tab.
Select the checkbox for “Stop Loss” and “Stop Loss Final” to display the black/red Average True Range Stop Loss step-lines
Make sure the checkboxes for "Upper Channel", "Middle Line", and "Lower Channel" are selected.
Select the "Plots Background" checkboxes for "Color 0" and "Color 1" so that the potential entry and exit zones become color-coded.
Having the checkbox for "Tables" selected allows you to see position sizing and other useful information within the chart.
Have the checkboxes for "Trades on chart" and "Signal Labels" selected for viewing entry and exit point labels and positions.
Uncheck* the "Quantity" checkbox.
Precision: select “Default”.
Check “Labels on price scale”
Check “Values in status line”
Strategy Application Guidelines:
Entry Conditions:
The strategy identifies long entry opportunities based on substantial money inflow, as detected by our proprietary indicators and oscillators. This assessment considers the strength and momentum of the inflow relative to previous periods, in conjunction with strong price momentum (indicated by our modified, less-lagging MACD) and/or a potential price reversal (indicated by our modified, less-noisy Stochastic). Additional confirmation criteria related to price action are also incorporated. Potential entry and exit zones are visually represented by bands on the chart.
A blue upward-pointing arrow, accompanied by the label 'Long' and green band fills, signifies a long entry opportunity. Conversely, a magenta downward-pointing arrow, labeled 'Close entry(s) order Long' with yellow band fills, indicates a potential exit.
Take Profit:
The strategy employs trailing stops, rather than fixed take-profit levels, to maximize gains while minimizing losses. Trailing stops adjust the stop-loss level as the stock price moves in a favorable direction. The strategy utilizes two types of trailing stop mechanisms: one based on the Average True Range (ATR), and another based on price action, which attempts to identify shifts in price momentum.
Stop Loss:
The strategy uses an Average True Range (ATR)-based stop-loss, represented by two lines on the chart. The black line indicates the primary ATR-based stop-loss level, set upon trade entry. The red line represents a secondary ATR stop-loss buffer, used in the position sizing calculation to account for potential slippage or price gaps.
To potentially reduce the risk of stop-hunting, discretionary traders might consider using a market sell order within the final 30 to 60 minutes of the main session, instead of automated stop-loss orders.
Order Types:
Market Orders are intended for use with this strategy, specifically when the candle and signal on the chart stabilize within the final 30 to 60 minutes of the main trading session.
Position Sizing:
A key aspect of this strategy is that its position size is calculated and displayed in a table on the chart. The position size is calculated based on stop-loss placement, including the stop-loss buffer, and the capital at risk per trade which is commonly set around 0.5% Risk on Capital per Trade.
Backtesting:
The backtesting results presented below the chart are for informational purposes only and are not intended to predict future performance. Instead, they serve as a tool for identifying instruments with which the strategy has historically performed well.
It's important to note that the backtester utilizes a tiny portion of the capital for each trade while our strategy relies on a diversified portfolio of multiple stocks or instruments being traded at once.
Important Considerations:
Volume data is crucial; the strategy will not load or function correctly without it. Ensure that your charts include volume data, preferably from a centralized exchange.
Our system is designed for trading a portfolio. Therefore, if you intend to use our system, you should employ appropriate position sizing, without leverage or margin, and seek out a variety of long opportunities, rather than opening a single trade with an excessively large position size.
If you are trading without automated signals, always allow the chart to stabilize. Refrain from taking action until the final 1 hour to 30 minutes before the end of the main trading session to minimize the risk of acting on false signals.
To align with the strategy's design, it's generally preferable to enter a trade during the same session that the signal appears, rather than waiting for a later session.
Disclaimer:
Trading in financial markets involves a substantial degree of risk. You should be aware of the potential for significant financial losses. It is imperative that you trade responsibly and avoid overtrading, as this can amplify losses. Remember that market conditions can change rapidly, and past performance is not indicative of future results. You could lose some or all of your initial investment. It is strongly recommended that you fully understand the risks involved in trading and seek independent financial advice from a qualified professional before using this strategy.

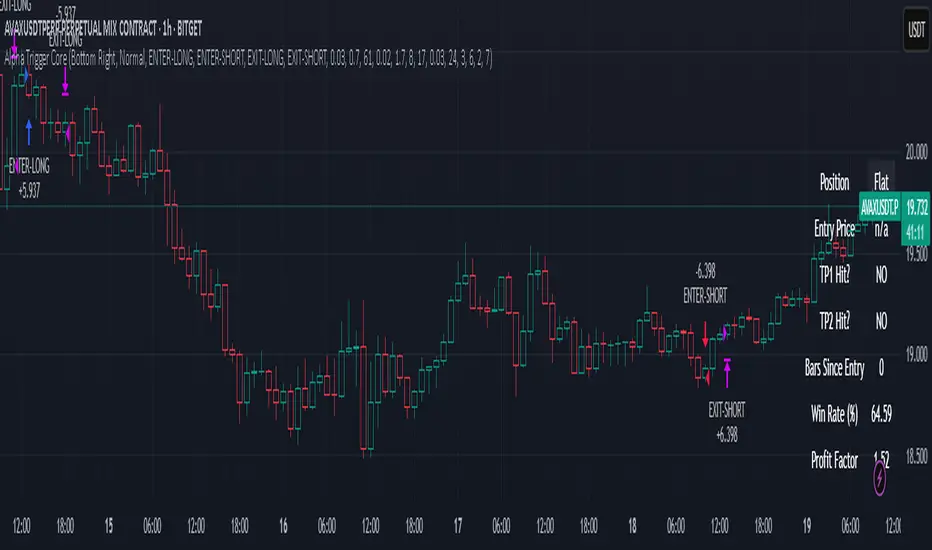
Alpha Trigger CoreAlpha Trigger Core — Trend Momentum Strategy with Dual Take Profit System
Alpha Trigger Core is a precision-engineered trend-following strategy developed for crypto and altcoin markets. Unlike simple indicator mashups, this system was built from the ground up with a specific logic framework that integrates trend, momentum, volatility, and structure validation into a single unified strategy.
It is not a random combination of indicators, but rather a coordinated system of filters that work together to increase signal quality and minimize false positives. This makes it especially effective on trending assets like BTC, ETH, AVAX, and SOL on the 1-hour chart.
🔍 How It Works
This strategy fuses multiple advanced filters into a cohesive signal engine:
🔹 Trend Identification
A hybrid model combining:
Kalman Filter — Smooths price noise with predictive tracking.
SuperTrend Overlay — Confirms directional bias using ATR.
ZLEMA Envelope — Defines dynamic upper/lower bounds based on price velocity.
🔹 Momentum Filter
Uses a ZLEMA-smoothed CCI to identify accelerating moves.
Long entries require a rising 3-bar CCI sequence.
Short entries require a falling 3-bar CCI sequence.
🔹 Volatility Strength Filter (Vortex Indicator)
Validates entries only when Vortex Diff exceeds a customizable threshold.
Prevents low-volatility "chop zone" trades.
🔹 Wick Trap Filter
Filters out false breakouts driven by liquidity wicks.
Validates that body structure supports the breakout.
📈 Entry & Exit Logic
Long Entry: All trend, momentum, volatility filters must align bullishly and wick traps must be absent.
Short Entry: All filters must align bearishly, with no wick rejection.
Early Exit: Uses ZLEMA slope crossover to exit before a full trend reversal is confirmed.
🎯 Take Profit System
TP1: Takes 50% profit at a user-defined % target.
TP2: Closes remaining 100% at second target.
Cooldown: Prevents immediate reentry and ensures clean position transitions.
📊 Real-Time Strategy Dashboard
Tracks and displays:
Position status (Long, Short, Flat)
Entry Price
TP1/TP2 Hit status
Win Rate (%)
Profit Factor
Bars Since Entry
Fully customizable position & font size
🤖 Bot-Ready Multi-Exchange Alerts
Compatible with WonderTrading, 3Commas, Binance, Bybit, and more.
Customizable comment= tags for entry, exit, TP1, and TP2.
Fully alert-compatible for webhook integrations.
📌 Suggested Use
Best used on trending crypto pairs with moderate-to-high volatility. Recommended on the 1H timeframe for altcoins and majors. Can be used for manual confirmation or automated trading.
🔒 Script Transparency
This is a closed-source script. However, the description above provides a transparent breakdown of the strategy’s core logic, filters, and execution model — ensuring compliance with TradingView’s publishing guidelines.
⚠️ Trading Disclaimer
This script is for educational purposes only and is not financial advice. Always conduct your own analysis before making investment decisions. Past performance does not guarantee future results. Use this strategy at your own risk.
Titan X 📈 Titan X – Optimized Trend Strategy with Gradient ZLEMA, RMI, CCI, ROC, and Volume Confirmation
Titan X is a precision-engineered trend-following strategy designed for crypto markets and high-volatility assets. It is not just a combination of indicators, but a carefully constructed, non-repainting system where each component plays a specific role in confirming high-probability trade setups. The strategy detects strong directional moves, confirms them with momentum and volume, and manages trade exits without relying on traditional stop losses.
🔍 How the Indicators Work Together
✅ 1. ZLEMA Baseline + Gradient Filter
A Zero Lag Exponential Moving Average (ZLEMA) is used to track directional trend with minimal lag.
A gradient (slope) is calculated from the ZLEMA to measure trend acceleration. This confirms whether a trend is gaining strength or losing momentum.
Entries are only taken when the ZLEMA gradient exceeds a user-defined threshold, ensuring trades are only taken in strong, developing trends.
✅ 2. RMI – Relative Momentum Index (with Memory)
RMI captures sustained momentum direction over time.
It helps validate that price isn't just spiking, but truly trending.
Titan X uses RMI as a trend memory filter, requiring consistent momentum alignment before entry.
✅ 3. Momentum Timing – ROC + CCI
The Rate of Change (ROC) determines the strength and direction of recent momentum.
The Commodity Channel Index (CCI) checks price deviation from a moving average baseline, identifying whether momentum is aligned with market structure.
This combo prevents trades in weak, flat, or conflicting conditions.
✅ 4. Volume Spike Confirmation
Titan X uses a relative volume filter, requiring the current bar’s volume to exceed a moving average threshold.
This ensures trades are only triggered when there is clear breakout interest from market participants, helping avoid fakeouts and low-volume moves.
🎯 Trade Entry & Exit Rules
✅ Entry Conditions:
All five filters must align:
Trend direction (ZLEMA slope)
Momentum (ROC & CCI)
Trend memory (RMI)
Volume (Spike filter)
Trades are entered on the next bar after all confirmations, ensuring 100% non-repainting behavior.
✅ Take Profit System (Multi-Level TP):
TP1: Closes 50% of the position at a user-defined % gain (default: 2%)
TP2: Closes the remaining 50% of the position at a higher % gain (default: 4%)
Each TP is executed via limit order to ensure realistic and backtestable fills.
❌ No Stop Loss Used
Instead of using fixed stop losses, Titan X closes positions early when trend conditions weaken.
This dynamic exit logic is based on a reversal in ZLEMA gradient, which serves as a weak trend detection system.
⏱️ Cooldown Logic
A 1-bar cooldown is enforced between trades to avoid same-bar exit/entry violations on TradingView.
This improves execution accuracy and avoids overtrading on choppy price action.
📊 Real-Time Strategy Dashboard
Titan X includes a live dashboard that provides full transparency:
Current Position (Long / Short / Flat)
Entry Price
TP1 Hit? / TP2 Hit?
Bars Since Entry
Win Rate (%)
Profit Factor
Ideal for both manual monitoring and automated bot strategies.
🔔 Bot-Ready Multi-Exchange Alerts
Alerts can be configured for:
ENTER-LONG, ENTER-SHORT
EXIT-LONG, EXIT-SHORT
TP1 / TP2 targets
Messages are fully customizable and designed for platforms like:
WonderTrading
3Commas
TradingConnector
⚙️ Designed For:
Timeframes: 1H and 4H (optimized for crypto)
Markets: Altcoins, BTC/ETH, high-volatility pairs
Traders: Trend-followers, momentum scalpers, algo bot users
Goal: High accuracy entries, structured exits, zero repainting, and flexible trade management
⚠️ TradingView Disclosure
This strategy is provided for educational purposes only. It does not constitute investment advice, nor does it guarantee any returns. Trading carries risk; test thoroughly before using in live environments.

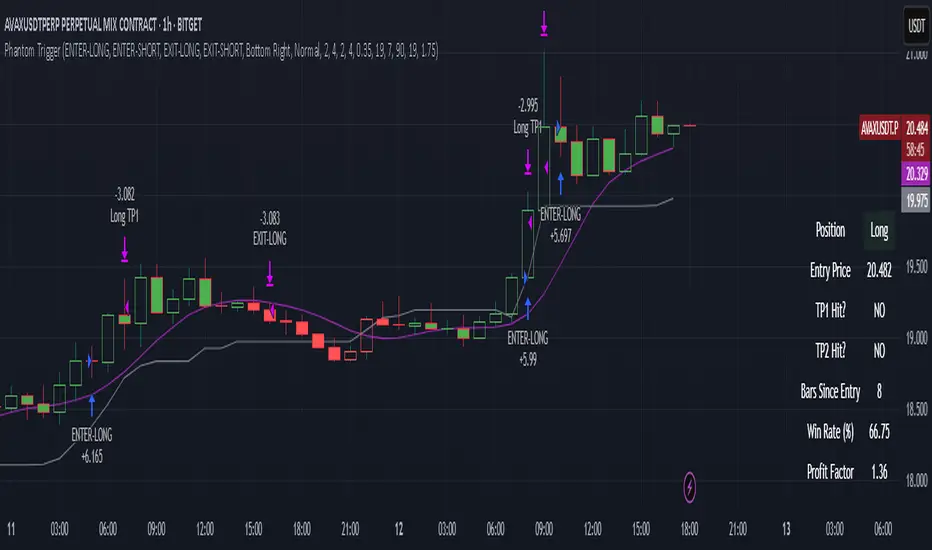
Phantom Trigger Phantom Trigger – Precision Trend Execution with TP1/TP2 and Weak Trend Exits
Phantom Trigger is a professional-grade trend-following strategy designed for crypto and high-volatility assets. It combines advanced trend detection with precise risk-managed exits using a multi-level take-profit system.
🔍 What It Does
Identifies strong directional moves using a multi-stage smoothed trend model
Confirms entries using structure-based logic and volume pressure
Filters trades using bias zones, confirmation levels, and trend acceleration
Automatically manages trades with two-stage take-profits (TP1 and TP2)
Exits early on trend weakness before reversal
Includes a styled real-time dashboard and bar coloring for visual guidance
Sends bot-compatible alerts for multi-exchange automation
⚙️ Core Components
Trend Engine: A smoothed dynamic filter detects real-time trend direction and momentum shifts
Bias Structure: Mid-high/low range-based logic determines if price is favoring bullish or bearish structure
Confirmation Levels: Short- and long-term zone crossovers confirm directional alignment
Volume Filter: Detects volume expansion spikes to validate strong breakout potential
TP1/TP2 Logic: Dynamically sets two profit targets and executes partial and full exits automatically
Weak Trend Exit: Closes positions one bar before reversal using directional filters
🧠 How to Use
Works best on crypto (1H, 4H) and high-volume instruments
Use dashboard stats to monitor position status, PnL, and TP1/TP2 progression
Alerts are pre-labeled and compatible with bots like 3Commas, Wunderbit, etc.
Can be adapted for both scalping and swing trading
📊 Dashboard
The built-in real-time dashboard displays current trade status, entry price, TP1/TP2 progress, win rate, profit factor, and bars since entry. It updates live with every candle and provides a quick-glance overview to support your decision-making during active trades.
🧠 How to Use
Works best on crypto (1H, 4H) and high-volume instruments
Use dashboard stats to monitor position status, PnL, and TP1/TP2 progression
Alerts are pre-labeled and compatible with bots like 3Commas, Wunderbit, etc.
Can be adapted for both scalping and swing trading
⚠️ Disclaimer
This script is for educational purposes only and does not constitute financial advice. Always test strategies thoroughly using demo or backtesting environments before applying to live markets. Past performance is not indicative of future results.
AI Volume StrategyAI Volume Strategy detects significant volume spikes and combines them with trend direction and candlestick color to generate buy and sell signals. The strategy uses an Exponential Moving Average (EMA) of volume to identify abnormal volume spikes that may indicate strong market activity. Additionally, it uses a 50-period EMA of price to filter the trend and decide on entry direction.
Key Features:
Volume Spike Detection: The strategy detects when the current volume exceeds the EMA of volume by a user-defined multiplier, signaling abnormal increases in market activity.
Trend Direction Filter: The strategy uses a 50-period EMA of price to determine the market trend. Buy signals are generated when the price is above the EMA (uptrend), and sell signals are generated when the price is below the EMA (downtrend).
Candle Color Filter: The strategy generates a buy signal only when the current candle is bullish (green) and a sell signal only when the current candle is bearish (red).
Exit after X Bars: The strategy automatically closes the position after a specified number of bars (default is 5 bars), but the exit condition can be adjusted based on user preference, timeframe, and backtesting results. The default exit is after 5 bars, but users can set it to 1 bar or any other number depending on their preferences and strategy.
Signals:
Buy Signal: Generated when a volume spike occurs, the trend is upward, and the current candle is bullish.
Sell Signal: Generated when a volume spike occurs, the trend is downward, and the current candle is bearish.
Alerts:
Buy Alert: Alerts the user when a buy signal is triggered.
Sell Alert: Alerts the user when a sell signal is triggered.
Visualization:
Buy Signal: A green label appears below the bar when the buy conditions are met.
Sell Signal: A red label appears above the bar when the sell conditions are met.
Volume EMA: Optionally, the Volume EMA line can be plotted on the chart to visualize volume trends.
This strategy helps traders identify potential entry points based on increased volume activity while considering trend direction and candlestick patterns. With the ability to adjust the exit condition, users can fine-tune the strategy to their specific needs and backtest results.

Stealth Trigger X🔰 Stealth Trigger X — Smart Divergence & Breakout Strategy with Trend Weakness Exit
Stealth Trigger X is a precision-engineered, non-repainting strategy designed for traders who rely on high-conviction breakouts and trend confirmation. Rather than relying on lagging or oversimplified signals, this strategy fuses divergence logic, volatility detection, volume filtering, and slope-based trend validation into one clean system — making it both responsive and reliable.
📌 Core Components (How It Works):
1. ZLEMA (Zero-Lag Exponential Moving Average):
Used as the primary trend baseline. Unlike a standard EMA, ZLEMA compensates for lag by using a double-smoothing technique that allows the strategy to detect trend direction changes sooner — especially useful in crypto and fast-moving markets.
2. Gradient Filter (Slope of ZLEMA):
Rather than waiting for price to cross a moving average, the strategy measures the slope of the ZLEMA itself. Positive slope = uptrend, negative slope = downtrend. This gives us early trend validation and exit signals based on weakening momentum.
3. Vortex Indicator (Directional Volatility):
A diff-based implementation of the Vortex Indicator is used to validate whether volatility is expanding in favor of the trend. This prevents false entries during indecision phases or low-momentum conditions.
4. White Line Bias Filter (Structural Trend):
The strategy calculates the midpoint of the highest high and lowest low over a user-defined period. This “White Line” serves as a structural trend bias, ensuring entries align with the broader context — not just momentary momentum.
5. Volume Spike Confirmation:
To avoid manipulation and choppy conditions, the strategy confirms breakouts only when the current bar’s volume exceeds the median volume of recent candles by a set multiplier. This filters out noise and ensures only high-conviction moves trigger entries.
6. Breakout with Divergence Timing:
A hybrid logic checks for price breaking previous range highs/lows (breakouts), combined with simulated divergence behavior based on RSI-like momentum. This helps align entry timing with areas where price is likely to accelerate.
⚙️ Trade Management Logic:
Entry Conditions:
Triggered when all conditions align: ZLEMA slope, Vortex confirmation, White Line bias, volume spike, and divergence-based breakout.
Take Profits:
TP1: 50% of position is closed using a limit order
TP2: Remaining 50% closed with another limit order
This split exit approach lets profits run while locking in gains early.
Exits on Trend Weakness:
If trend conditions weaken (slope flip or vortex flip), the position is exited before a full reversal occurs — helping protect capital during exhaustion phases.
Reentry Delay:
Enforces a 1-bar cooldown between exit and new entries to avoid “ping-pong” signals and maintain clean backtest results.
📊 Real-Time Dashboard (On-Chart):
Displays critical stats including:
Current position (Long, Short, or Flat)
Entry price
TP1 and TP2 hit status
Win rate (%)
Profit factor
Bars since entry
This makes live trading or visual backtesting easy to interpret and track.
✅ Key Facts:
Non-Repainting: All signals are calculated using confirmed bar data only. No future bars or security() functions are used.
Original Logic: This is not a generic mashup. Each component (ZLEMA slope, vortex diff, breakout divergence, volume spike filtering, White Line structure) is optimized to work in tandem.
Best Timeframes: 1H – 4H
Markets: Crypto, Forex, Indices — any market with trending behavior and measurable volume
⚠️ Disclaimer:
This strategy is for educational purposes only. It is not financial advice or a recommendation to trade. Past performance does not guarantee future results. Always trade with proper risk management and backtest strategies before live deployment.
🧠 Summary:
Stealth Trigger X is built for traders who want:
Precision entries
Early trend exits
Reliable backtest integrity
Clean logic with no repainting
It is especially effective in breakout environments where volume and momentum align — and excels at avoiding weak or manipulated trends.

Hyperion Crypto Matrix: Ultimate Market Sentinel
// 🔰 HYPERION CRYPTO MATRIX: ULTIMATE MARKET SENTINEL
// ─────────────────────────────────────────────────────────────────────────────
/*
The **Hyperion Crypto Matrix** is an advanced crypto trend-following strategy built from the ground up for precision, not just performance. Unlike traditional “mashups” of indicators, this system was **engineered around synergy**—each module is purpose-driven and non-redundant, delivering fast, filtered, high-probability signals in volatile crypto markets.
─────────────────────────────────────────────────────────────
📌 STRATEGY PURPOSE
─────────────────────────────────────────────────────────────
Hyperion is built for **1-hour crypto trading** and optimizes for:
- High Win Rate
- Early Exits on Trend Weakness
- Partial Position Scaling (TP1/TP2)
- Real-time trade performance tracking
It is ideal for traders who want **real-time trade logic** with:
- No repainting
- No overfitting
- Realistic entry/exit structure
- No same-bar entry & exit (enforces 1-bar delay)
─────────────────────────────────────────────────────────────
🧠 WHAT MAKES IT ORIGINAL
─────────────────────────────────────────────────────────────
Each component is **custom-integrated** with strict role separation:
- **Trend Direction:** Enhanced Wave Oscillator (EWO) with adaptive band filtering
- **Trend Strength Memory:** Relative Momentum Index (RMI) with threshold locking
- **Volume Confirmation:** Historical relative volume spike filter using SMA multiplier
- **Momentum Weakness Exit:** Combined ROC and CCI to detect early reversal before price turns
- **Position Tracking:** TP1 (50% exit), TP2 (100% close) with cooldown to prevent whipsaws
- **Dynamic Dashboard:** Real-time stats including win rate, PnL efficiency, and TP hit status
These aren’t just “plugged in” indicators—they are synchronized to **filter, confirm, and adapt** to price action with timing logic that prevents premature entries or late exits.
─────────────────────────────────────────────────────────────
📊 INDICATOR LOGIC OVERVIEW
─────────────────────────────────────────────────────────────
1. **📈 Enhanced Wave Oscillator (EWO):**
- Calculates the delta between a fast and slow EMA (5 vs. 34 by default)
- Uses a dynamic banding system to detect peaks/troughs and prevent entries during exhaustion
- Filters only active, accelerating trends — reducing false positives
2. **🧠 Relative Momentum Index (RMI):**
- Similar to RSI but with a forward-looking momentum comparison
- Confirms trend *persistence* over time, preventing entries on short-term flips
- Long entries only allowed when RMI > threshold (default 55), short if RMI < 45
3. **🔊 Volume Spike Filter:**
- Uses 20-bar SMA of volume and a multiplier (1.5x default) to detect **relative volume breakouts**
- Prevents trades in low-liquidity environments (e.g., chop, overnight sessions)
4. **📉 Weak Trend Close Logic:**
- Combines Rate of Change (ROC) and Commodity Channel Index (CCI)
- Detects early signs of momentum deterioration, often before the trend visually reverses
- Triggers exit before price falls into sideways zones
5. **🎯 Take Profit System (TP1/TP2):**
- TP1: 50% position closed at +2% (default)
- TP2: Full close at +4% (default)
- Uses `strategy.exit()` with limit orders based on entry price
6. **⏱️ Reentry Cooldown:**
- After TP2 or weak trend exit, system enforces a 1-bar delay before reentry
- Avoids frequent churn in flat or noisy environments
7. **📋 Real-Time Dashboard (Optional):**
- Displays live trade status, PnL metrics, TP1/TP2 hit status, bars since entry, win rate %, and profit factor
- Color-coded background to highlight active trade direction (green for long, red for short)
─────────────────────────────────────────────────────────────
⚙️ HOW TO USE
─────────────────────────────────────────────────────────────
1. Load on a 1H chart of a crypto asset with good liquidity (e.g., BTC, ETH, LINK)
2. Toggle between \"Long Only\", \"Short Only\", or \"Both\" in the settings
3. Use default TP1/TP2 percentages, or tune them for the asset’s volatility
4. Observe trade execution and live stats on the optional dashboard
5. Review the bar coloring for EWO trend bias confirmation
> Stop-loss logic is not included. This strategy assumes exits occur at TP2 or on trend/momentum failure.
─────────────────────────────────────────────────────────────
⚖️ TRADINGVIEW COMPLIANCE & USAGE DISCLAIMER
─────────────────────────────────────────────────────────────
This strategy does **not repaint**, is fully compatible with **TradingView backtesting**, and adheres to all known Pine Script execution rules.
⚠️ **Disclaimer:** This script is for educational purposes only and does not constitute financial advice. Trading cryptocurrencies involves significant risk. Always test strategies on a demo account and consult with a financial advisor before live trading.
─────────────────────────────────────────────────────────────
🧪 CONCLUSION
─────────────────────────────────────────────────────────────
The **Hyperion Crypto Matrix** is not a mashup—it’s a **modular, optimized, logic-driven system** crafted for real-world crypto trading. Every component has been tuned for function, not fluff. Whether you're backtesting or live trading, this system is designed to give you **structured, actionable edge** with live feedback every step of the way.
*/

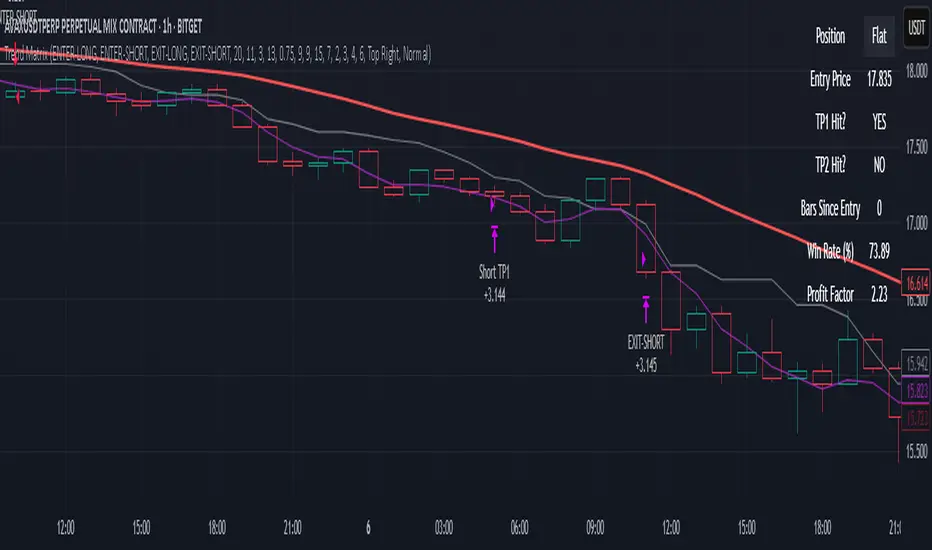
Trend MatrixFinal TradingView-Compliant Description for Trend Matrix
Trend Matrix is a precision-engineered trend-following strategy built for high-confidence entries and tactical trade management.
This strategy combines multiple non-repainting filters, each with a distinct role, to form a unified "trend matrix" that confirms directional bias, volume commitment, and momentum strength — all before entry is considered.
🔍 Core Components & Why They’re Used
🧠 Gaussian Filter (Custom)
A smoothed Gaussian-weighted moving average is used to detect trend direction changes. Unlike standard EMAs, this filter minimizes lag while retaining smooth transitions — ideal for confirming trend shifts without false reversals.
📈 RMI Trend Memory
A Relative Momentum Index is used to validate trend direction persistence. RMI's ability to filter out short-term oscillations makes it ideal for confirming whether a trend is still active.
📊 Gradient Filter (ZLEMA-based)
Measures the slope of a ZLEMA-smoothed close. If slope flips, it signals a potential trend weakness. This provides real-time confirmation for entry or exit bias.
📉 Volume Spike Detection
Confirms that breakouts or trend continuations are supported by volume commitment. Uses a dynamic SMA-based volume filter with a user-defined multiplier.
🟦 White Line (Bias Midpoint)
This structural component calculates the midpoint of the highest high and lowest low over a range — providing directional context and helping eliminate trades in consolidation zones.
🎯 Entry Conditions
Long entries require:
Gaussian trend flip to the upside
RMI > 50 (bullish memory)
Volume spike confirmation
Positive gradient (ZLEMA slope)
Price above White Line (bias filter)
Short entries use the inverse logic.
All entries enforce a cooldown bar to prevent same-bar reversals or whipsaw trades.
🎯 Exit Conditions
Take Profit 1: 50% of position at +2%
Take Profit 2: Remaining 50% at +4%
Early Exit on Trend Weakness:
Position closes fully if the trend weakens (RMI flip or gradient reversal)
📊 Dashboard + Performance Tracking
The built-in dashboard shows:
Current Position
Entry Price
TP1/TP2 Hit Status
Bars Since Entry
Win Rate (%)
Profit Factor
Useful for manual tracking or live trading review.
🌐 Multi-Exchange Bot Compatibility
Trend Matrix is built with universal trade alerts using customizable comment= fields. This makes it compatible with any exchange-connected bot platform such as:
WunderTrading
3Commas
Alertatron
Cornix
Or any webhook-based trading system
Alerts are sent using the {{strategy.order.comment}} placeholder, allowing you to route entries and exits through your preferred exchange account on Binance, Bybit, OKX, Kraken, and others.
🛠️ Customization
All components are modular:
TP1/TP2 levels
Gaussian length & sigma
Volume spike filter sensitivity
Gradient & White Line length
RMI settings
You can tailor the strategy for different assets or timeframes — optimized for crypto 1H, but works with stocks, FX, or lower timeframes with adjusted parameters.
✅ Final Notes
Trend Matrix is not just a mashup — it's a synchronized system of filters with clear roles, designed to maximize trade confidence and minimize noise. Every layer of confirmation serves a purpose, making this a highly adaptive trend-following tool for any market environment.
⚠️ Disclaimer (as required by TradingView)
This script is for educational purposes only and does not constitute financial advice. Use at your own risk. Always test strategies thoroughly before applying them in live trading environments. Past performance is not indicative of future results.
Tactical FlowTactical Flow – Altcoin Swing Strategy with Trend Logic & Dynamic TP System
(Built for 1H timeframe altcoin trading)
🎯 Purpose
Tactical Flow is a swing trading strategy purpose-built for altcoins on the 1-hour timeframe. It targets clean trend continuation setups by combining non-repainting filters for direction, momentum, and volume with a real-time execution engine that strictly avoids same-bar reversals. It includes a dynamic take-profit system with real-time trade tracking and an integrated visual dashboard.
⚙️ Strategy Core Components
Each module was chosen for precision, trend clarity, and altcoin-specific price behavior.
🔹 1. White Line Bias
Defines market structure using the midpoint of recent high/low range.
→ Keeps you trading with the dominant structure.
🔹 2. Tether Trend Engine
Two mid-range bands (Fast & Slow Tether) act like a dynamic trend cloud.
→ Ensures trend direction is confirmed with structural layering.
🔹 3. ZLEMA Gradient Filter
A Zero Lag EMA of price that’s compared to its previous value for momentum slope.
→ Confirms the trend has actual energy behind it.
🔹 4. TEMA Micro-Flow
A smoothed directional signal to confirm price is accelerating, not just trending.
→ Filters out late or fading entries.
🔹 5. Volume Spike Filter
Confirms that breakouts are real by requiring volume > 1.5× median of previous candles.
→ Designed for altcoins to avoid fakeouts during random volatility.
🔹 6. RMI Trend Memory
Keeps track of the trend state over time, allowing for smoother transitions and fewer whipsaws.
→ Helps the strategy stay in trend longer and only reverse when confirmation is strong.
🔹 7. Reversal Cooldown Logic
Exits a trade, then waits 1 full bar before taking a reversal entry.
→ Avoids common backtest false positives where entries and exits occur on the same candle.
💸 Trade Management – TP1/TP2 Logic
TP1 = 50% closed when price hits target 1
TP2 = full exit
Exits early if trend weakens
Supports dynamic reentry after TP2 if trend resumes
→ Keeps risk controlled while allowing position scaling in volatile altcoin swings.
📊 Strategy Dashboard
Visual interface shows:
Current Position (Long / Short / Flat)
Entry Price
TP1 and TP2 hit status
Bars since entry
Real-time Win Rate
Profit Factor
🧪 Backtesting & Execution Compliance
✅ Fully non-repainting
✅ Compatible with TradingView's deep backtesting
✅ Uses strategy.exit with limit logic for accurate TP tracking
✅ No stop-loss — closes trades on trend weakening only
🔥 Best Use Case
Altcoin swing trades on 1H chart
Works well during trending periods with volume
Not designed for choppy or sideways conditions
Pairs well with watchlist scanners and heatmaps

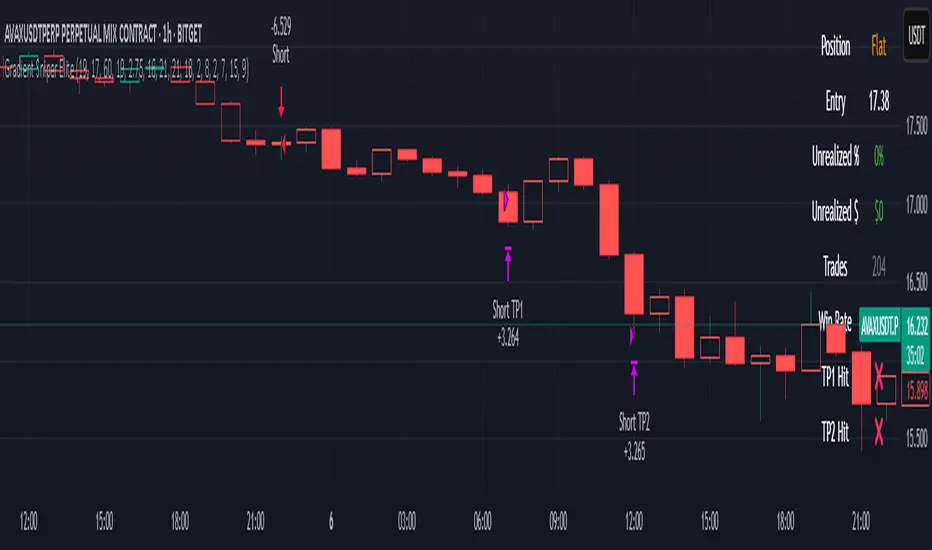
Gradient Sniper Elite🧠 Gradient Sniper Elite — Precision Trend Detection and Tactical Trade Execution for Crypto
Gradient Sniper Elite is a high-performance crypto trend strategy engineered for accuracy, adaptability, and smart execution on the 1-hour timeframe. This script is not just a mashup — it's a purpose-built system that combines trend, momentum, and volume filters in a structured and non-repainting framework designed for optimal entry and exit timing.
🔍 What Makes It Original?
This strategy combines several proven concepts into a unified, precision-calibrated trade engine:
✅ ZLEMA Gradient Filter: A slope-based trend filter that captures the direction and strength of momentum shifts without repainting.
✅ TEMA Confirmation: Triple EMA logic confirms trend acceleration or exhaustion by analyzing layered EMA cross-smoothing.
✅ RMI-Based Trend Direction: Replaces traditional RSI with a Relative Momentum Index (RMI), which smooths price momentum and avoids lag.
✅ ROC & Smoothed CCI: Dual momentum filters ensure that trades align with both velocity and structure of price moves.
✅ Volume Spike Filter: Filters out false breakouts and manipulation by confirming entries only during statistically significant volume surges.
✅ TP1/TP2 Split Take Profit Logic: 50% partial exit at TP1 and full exit at TP2. Ensures flexible profit-taking while maximizing trend continuation gains.
✅ Trend Weakness Exit: Trades are exited cleanly when the trend begins to weaken (as confirmed by RMI flip), preventing overstay and drawdown.
✅ 1-Bar Reversal Delay: The system enforces a 1-bar delay between a trade closure and any potential reversal entry, ensuring clean trend reversals and realistic live trading behavior.
✅ No Stop Loss: This strategy does not use a stop loss. Instead, it exits trades based on trend weakness or TP2 being hit. This avoids premature exits in volatile crypto environments, while maintaining controlled and dynamic trade management logic.
⚙️ How It Works
This strategy uses multi-layered confirmation:
Trend Structure
ZLEMA Gradient: Captures the slope of price action.
White Line + Fast/Slow Tether Lines: Define macro trend structure and act as dynamic S/R filters.
Momentum Alignment
Rate of Change (ROC): Measures directional velocity.
Smoothed CCI: Refines entry timing within the trend.
TEMA: Adds second-layer trend confirmation.
Volume Confirmation
Entry signals are validated by detecting relative volume spikes compared to a moving average baseline, avoiding entries on low-volume or fake breakouts.
Trade Management
Dynamic take-profits (TP1/TP2).
Immediate exit on trend weakening.
No same-bar entry/exit — reversal entries are delayed until after full exit confirmation.
No stop loss — trade management is handled via trend logic and take profit levels.
📊 Dashboard Overview
Gradient Sniper Elite includes a built-in dashboard in the top-right corner of the chart. It dynamically updates on each bar and shows:
📍 Position: Displays "Long", "Short", or "Flat" depending on the active trade
💰 Entry Price: The exact price where the trade was entered
📈 Unrealized %: Current profit/loss as a percentage
💵 Unrealized $: Estimated PnL in dollars, scaled to your backtest capital
📊 Trades / Win Rate: Live counter for total trades, win/loss count, and win rate
🎯 TP1 Hit / TP2 Hit: Shows ✅ or ❌ depending on whether each target level was reached during the current trade
This dashboard helps you monitor trade status, track live performance, and validate signal behavior in real time — all without repainting or relying on external tools.
📈 How to Use
Timeframe: Optimized for the 1-hour timeframe, but adaptable.
Asset Class: Primarily built for crypto markets, especially fast-moving alts like AVAX, LINK, QNT, etc.
Trade Mode: Supports long and short trades with clean reversal logic.
Dashboard: Live stats including position status, TP1/TP2 hit, win rate, and real-time PnL tracking.
Backtest Ready: Built with full compliance to TradingView backtest engine — results are realistic and match live-bar behavior.
⚠️ No Repainting — No Guesswork
Every element in this script is designed to work with confirmed bar data only. There is zero forward-looking logic. This makes Gradient Sniper Elite fully compatible with both backtesting and live algo execution.
🧩 Why This Isn’t Just a Mashup
Each indicator in this strategy has a specific role:
ZLEMA: Core trend slope engine.
TEMA: Trend reinforcement.
RMI: Directional decision layer.
CCI & ROC: Entry timing refinement.
Volume Filter: Risk filtering.
They’re not merged randomly, but combined in sequence to eliminate noise and optimize entries.
📌 Disclaimer
This script is for informational and educational purposes only. It does not constitute financial advice or a recommendation to buy or sell any asset. Always do your own research and use appropriate risk management when trading. Past performance does not guarantee future results.
NY First Candle Break and RetestStrategy Overview
Session and Time Parameters:
The strategy focuses on the New York trading session, starting at 9:30 AM and lasting for a predefined session length, typically 3 to 4 hours. This timing captures the most active market hours, providing ample trading opportunities.
Strategy Parameters:
Utilizes the Average True Range (ATR) to set dynamic stop-loss levels, ensuring risk is managed according to market volatility.
Employs a reward-to-risk ratio to determine take profit levels, aiming for a balanced approach between potential gains and losses.
Strategy Settings:
Incorporates simple moving averages (EMA) and the Volume Weighted Average Price (VWAP) to identify trend direction and price levels.
Volume confirmation is used to validate breakouts, ensuring trades are based on significant market activity.
Trade Management:
Features a trailing stop mechanism to lock in profits as the trade moves in favor, with multiple take profit levels to secure gains incrementally.
The strategy is designed to handle both long and short positions, adapting to market conditions.
Alert Settings:
Provides alerts for key events such as session start, breakout, retest, and entry signals, helping traders stay informed and act promptly.
Visual cues on the chart highlight entry and exit points, making it easier for beginners to follow the strategy.
This strategy is particularly suited for the current volatile market environment, where simplicity and clear guidelines can help beginner traders navigate the complexities of trading. It emphasizes risk management and uses straightforward indicators to make informed trading decisions.
I put together this Trading View scalping strategy for futures markets with some help from Claude AI. Shoutout to everyone who gave me advice along the way—I really appreciate it! I’m sure there’s room for improvement, so feel free to share your thoughts… just go easy on me. :)

ZVGS Reactor🧠 ZVGS Reactor - High-Accuracy Trend Confirmation Strategy (Pine Script v6)
🚀 Overview
ZVGS Reactor is a precision-engineered, multi-layered trading strategy designed for crypto, forex, and equity markets. It blends adaptive trend tracking, directional strength confirmation, and volume validation to generate high-probability entries and exits. Built on a non-repainting foundation, the strategy ensures reliable performance in both backtesting and live trading environments.
🔹 How This Strategy Works (Indicator Fusion)
The ZVGS Reactor combines four core components:
1️⃣ ZLEMA Baseline for Trend Bias
📌 What It Does: Tracks the smoothed price trend and defines directional bias.
✔ Zero Lag Exponential Moving Average (ZLEMA)
Adaptive and responsive to price movement
Price above ZLEMA = bullish bias
Price below ZLEMA = bearish bias
2️⃣ Gradient Trend Filter for Momentum Slope
📌 What It Does: Measures slope strength to confirm directional momentum.
✔ Gradient Filter
Positive slope = bullish push
Negative slope = bearish pressure
3️⃣ Vortex Indicator (RMA Smoothed) for Trend Strength
📌 What It Does: Confirms whether the market is trending strongly in one direction.
✔ Vortex Indicator (VI)
VI+ > VI- = Bullish trend
VI- > VI+ = Bearish trend
Normalized & threshold-filtered for reliable confirmations
4️⃣ Volume Confirmation with Spike or Moving Average Toggle
📌 What It Does: Filters for strong market participation to reduce false breakouts.
✔ Volume Confirmation System
Spike Mode: Volume must exceed 1.5x its recent average
Toggle Option: Switch between spike mode and standard volume > average
Prevents entries in low-volume chop conditions
🎯 Entry & Exit Logic
✔ Long Entry (All Conditions Must Be Met):
Price above ZLEMA
Gradient slope > 0
Vortex confirms bullish strength
Volume passes confirmation filter
✔ Short Entry (All Conditions Must Be Met):
Price below ZLEMA
Gradient slope < 0
Vortex confirms bearish strength
Volume passes confirmation filter
✔ Exits (Fully Automated):
TP1: Close 50% at the first target
TP2: Fully exit at the second target
Stop Loss: Configurable SL included
🔧 Strategy Customization
All parameters are fully adjustable:
✅ ZLEMA length
✅ Volume confirmation mode (Spike or SMA)
✅ TP1/TP2/SL % levels
✅ Vortex length & threshold
✅ Gradient smoothing period
📈 Recommended Use Cases
Markets:
✅ Crypto (BTC, ETH, SOL, etc.)
✅ Forex (EUR/USD, GBP/JPY, etc.)
✅ Stocks & Indices (SPX, NASDAQ, DAX)
Timeframes:
✅ Swing: 1H – 4H – 1D
✅ Intraday: 5M – 15M – 30M
⚙️ Backtest Settings for Realistic Simulation
Initial Capital: $1,000
Commission: 0.05%
Slippage: 1
Date Filter: Built-in start and end time range
📢 TradingView Disclaimer
This script is for educational purposes only and does not constitute financial advice. Trading involves risk. Past performance is not indicative of future results. Always use demo testing before live deployment. Users are fully responsible for their own trading decisions.
🚀 Why Choose ZVGS Reactor?
✅ Zero-lag baseline with adaptive filtering
✅ Trend, strength, and volume confirmation
✅ Volume spike toggle for flexibility
✅ 100% Non-repainting — true signal stability
✅ Clean dashboard with real-time stats
✅ Works across all markets and timeframes
📢 Start Trading Smarter with ZVGS Reactor!
🔗 Use it on TradingView today and optimize your edge. 🔥

VWAP StrategyVWAP and volatility filters for structured intraday trades.
How the Strategy Works
1. VWAP Anchored to Session
VWAP is calculated from the start of each trading day.
Standard deviations are used to create bands above/below the VWAP.
2. Entry Triggers: Al Brooks H1/H2 and L1/L2
H1/H2 (Long Entry): Opens below 2nd lower deviation, closes above it.
L1/L2 (Short Entry): Opens above 2nd upper deviation, closes below it.
3. Volatility Filter (ATR)
Skips trades when deviation bands are too tight (< 3 ATRs).
4. Stop Loss
Based on the signal bar’s high/low ± stop buffer.
Longs: signalBarLow - stopBuffer
Shorts: signalBarHigh + stopBuffer
5. Take Profit / Exit Target
Exit logic is customizable per side:
VWAP, Deviation Band, or None
6. Safety Exit
Exits early if X consecutive bars go against the trade.
Longs: X red bars
Shorts: X green bars
Explanation of Strategy Inputs
- Stop Buffer: Distance from signal bar for stop-loss.
- Long/Short Exit Rule: VWAP, Deviation Band, or None
- Long/Short Target Deviation: Standard deviation for target exit.
- Enable Safety Exit: Toggle emergency exit.
- Opposing Bars: Number of opposing candles before safety exit.
- Allow Long/Short Trades: Enable or disable entry side.
- Show VWAP/Entry Bands: Toggle visual aids.
- Highlight Low Vol Zones: Orange shading for low volatility skips.
Tuning Tips
- Stop buffer: Use 1–5 points.
- Target deviation: Start with VWAP. In strong trends use 2nd deviation and turn off the counter-trend entry.
- Safety exit: 3 bars recommended.
- Disable short/long side to focus on one type of reversal.
Backtest Setup Suggestions
- initial_capital = 2000
- default_qty_value = 1 (fixed contracts or percent-of-equity)

GQT GPT - Volume-based Support & Resistance Zones V2搞钱兔,搞钱是为了更好的生活。
Title: GQT GPT - Volume-based Support & Resistance Zones V2
Overview:
This strategy is implemented in PineScript v5 and is designed to identify key support and resistance zones based on volume-driven fractal analysis on a 1-hour timeframe. It computes fractal high points (for resistance) and fractal low points (for support) using volume moving averages and specific price action criteria. These zones are visually represented on the chart with customizable lines and zone fills.
Trading Logic:
• Entry: The strategy initiates a long position when the price crosses into the support zone (i.e., when the price drops into a predetermined support area).
• Exit: The long position is closed when the price enters the resistance zone (i.e., when the price rises into a predetermined resistance area).
• Time Frame: Trading signals are generated solely from the 1-hour chart. The strategy is only active within a specified start and end date.
• Note: Only long trades are executed; short selling is not part of the strategy.
Visualization and Parameters:
• Support/Resistance Zones: The zones are drawn based on calculated fractal values, with options to extend the lines to the right for easier tracking.
• Customization: Users can configure the appearance, such as line style (solid, dotted, dashed), line width, colors, and label positions.
• Volume Filtering: A volume moving average threshold is used to confirm the fractal signals, enhancing the reliability of the support and resistance levels.
• Alerts: The strategy includes alert conditions for when the price enters the support or resistance zones, allowing for timely notifications.
⸻
搞钱兔,搞钱是为了更好的生活。
标题: GQT GPT - 基于成交量的支撑与阻力区间 V2
概述:
本策略使用 PineScript v5 实现,旨在基于成交量驱动的分形分析,在1小时级别的图表上识别关键支撑与阻力区间。策略通过成交量移动平均线和特定的价格行为标准计算分形高点(阻力)和分形低点(支撑),并以自定义的线条和区间填充形式直观地显示在图表上。
交易逻辑:
• 进场条件: 当价格进入支撑区间(即价格跌入预设支撑区域)时,策略在没有持仓的情况下发出做多信号。
• 离场条件: 当价格进入阻力区间(即价格上升至预设阻力区域)时,持有多头头寸则会被平仓。
• 时间范围: 策略的信号仅基于1小时级别的图表,并且仅在指定的开始日期与结束日期之间生效。
• 备注: 本策略仅执行多头交易,不进行空头操作。
可视化与参数设置:
• 支撑/阻力区间: 根据计算得出的分形值绘制支撑与阻力线,可选择将线条延伸至右侧,便于后续观察。
• 自定义选项: 用户可以调整线条样式(实线、点线、虚线)、线宽、颜色及标签位置,以满足个性化需求。
• 成交量过滤: 策略使用成交量移动平均阈值来确认分形信号,提高支撑和阻力区间的有效性。
• 警报功能: 当价格进入支撑或阻力区间时,策略会触发警报条件,方便用户及时关注市场变化。
⸻

Apex Trend SniperApex Trend Sniper - Advanced Trend Trading Strategy (Pine Script v5)
🚀 Overview
The Apex Trend Sniper is an advanced, fully automated trend-following strategy designed for crypto, forex, and stock markets. It combines momentum analysis, trend confirmation, volume validation, and adaptive risk management to capture high-probability trades. Unlike many strategies, this system is 100% non-repainting, ensuring reliable backtesting and real-time execution.
🔹 How This Strategy Works (Indicator Mashup)
The Apex Trend Sniper leverages multiple indicators to create a robust multi-layered confirmation system:
1️⃣ Trend Identification with RMI & McGinley Dynamic
📌 What It Does: Identifies the dominant trend and prevents trading against market conditions.
✔ McGinley Dynamic Baseline:
A highly adaptive moving average that dynamically reacts to price changes.
Price above the baseline = bullish trend.
Price below the baseline = bearish trend.
✔ Relative Momentum Index (RMI):
A refined Relative Strength Index (RSI) that filters out weak trends.
Above 50 = bullish confirmation.
Below 50 = bearish confirmation.
2️⃣ Trend Strength Confirmation with Vortex Indicator
📌 What It Does: Confirms that a detected trend is strong and valid.
✔ Vortex Indicator (VI):
Measures directional movement and trend strength.
A bullish trend is confirmed when VI+ > VI-.
A bearish trend is confirmed when VI- > VI+.
3️⃣ Volume Spike Detection for Trade Validation
📌 What It Does: Ensures that trades are placed only during strong market participation.
✔ Volume Confirmation:
A trade signal is only valid if volume spikes above the moving average.
Helps avoid false breakouts and weak trends.
4️⃣ Entry & Exit Strategy with Multi-Level Take Profits
📌 What It Does: Enters trades only when all conditions align and manages risk effectively.
✔ Entry Conditions (All must be met):
Price is above/below McGinley Dynamic.
RMI confirms trend direction.
Vortex indicator confirms trend strength.
Volume spike is detected.
✔ Exit Conditions:
Take Profit 1 (TP1): Secures 50% of the position at the first price target.
Take Profit 2 (TP2): Closes the remaining position at the second price target.
Exit Before Reversal: If an opposite trend signal appears, the position is closed early.
Trend Weakness Exit: If momentum weakens, the trade is exited automatically.
📌 Strategy Customization
🔧 Fully customizable to fit any trading style:
✔ McGinley Dynamic Length – Adjust baseline sensitivity.
✔ RMI & Vortex Settings – Fine-tune momentum filters.
✔ Volume Thresholds – Modify spike detection for better accuracy.
✔ Take Profit Levels – Set TP1 & TP2 based on market volatility.
📢 How to Use Apex Trend Sniper
1️⃣ Apply the strategy to any TradingView chart.
2️⃣ Customize the settings to fit your trading approach.
3️⃣ Use the backtest report to evaluate performance.
4️⃣ Monitor the dashboard to track real-time trade execution.
📌 Recommended Timeframes & Markets
✔ Best Markets:
✅ Crypto (BTC, ETH, SOL, etc.)
✅ Forex (EUR/USD, GBP/USD, JPY/USD, etc.)
✅ Stocks & Indices (S&P500, NASDAQ, etc.)
✔ Optimal Timeframes:
✅ Swing Trading: 1H – 4H – 1D
✅ Intraday & Scalping: 5M – 15M – 30M
📌 Backtest Settings for Realistic Performance
✔ Initial Capital: $1000 (or more for scaling).
✔ Commission: 0.05% (to simulate exchange fees).
✔ Slippage: 1-2 (to account for execution delay).
✔ Date Range: Test across different market conditions.
📢 TradingView Disclaimer
📌 This script is for educational purposes only and does not constitute financial advice. Trading carries significant risk, and past performance does not guarantee future results. Always test strategies thoroughly before applying them in a live market. Users are responsible for their own trading decisions.
🚀 Why Choose Apex Trend Sniper?
✅ Non-Repainting – No misleading signals.
✅ Multi-Layer Confirmation – Reduces false trades.
✅ Volume & Trend Strength Validation – Ensures high-probability entries.
✅ Adaptive Risk Management – Secures profits while maximizing trends.
✅ Versatile Across Markets & Timeframes – Works for crypto, forex, and stocks.
📢 Start Trading Smarter with Apex Trend Sniper! 🚀
🔗 Try it now on TradingView and optimize your trend-following strategy. 🔥

Trend Hunter Scalping [Daddin Algo]Trend Hunter Scalping Strategy Description
This strategy is a comprehensive scalping system designed to capture high-frequency trading opportunities within short timeframes. It combines multiple technical indicators to assess trend direction, momentum, volatility, and volume dynamics. Importantly, all parameters are user-adjustable, allowing the strategy to be optimized for various market conditions and individual preferences.
Technical Indicators and Settings
EMA (Exponential Moving Average):
The EMA is calculated based on a user-defined period. Rather than being fixed (e.g., a 200-period EMA), the period is adjustable to suit different market conditions. The position of the price relative to the EMA helps confirm the overall trend.
RSI & RSIOver:
The Relative Strength Index (RSI) measures momentum and the speed of price changes. Entry signals are generated when the RSI crosses its moving average. Additionally, overbought and oversold thresholds (set by the user) add an extra layer of confirmation for the signals.
ADX:
The Average Directional Index (ADX) assesses the strength of the current trend. When the ADX is above a user-specified threshold, the signals are considered more reliable. This helps in filtering out signals during weak trending periods.
Bollinger Bands:
Bollinger Bands gauge market volatility. The settings—including the length and the multiplier—are adjustable, providing flexibility to accommodate tightening or expanding volatility conditions.
Parabolic SAR:
This indicator identifies dynamic support and resistance levels, confirming the trend direction and helping pinpoint potential entry and exit points.
Pivot Levels (Fibonacci):
Calculated from the previous period's high, low, and close, pivot points and Fibonacci levels indicate potential reversal points and serve as support and resistance levels. These levels provide context for setting trailing stops and managing risk.
Volume Filter:
A volume condition ensures that trading signals are only considered valid when the current volume exceeds a multiple of its short-term moving average. This filter is adjustable, helping to confirm the strength of the market move.
Daddin Line:
Derived from a short-term moving average of the closing prices with a user-defined offset, the Daddin Line acts as an additional confirmation tool. Its parameters can be customized to better align with specific trading environments.
Trading Logic and Management
Signal Direction and Entry:
The strategy can generate both long (buy) and short (sell) signals, or be limited to one direction based on user preference. Entry orders are executed when all the selected indicator conditions are met. Additionally, maximum consecutive trade limits are implemented to help control risk.
Exit & Take Profit:
Trades are exited automatically when a user-defined profit percentage is reached. This take-profit percentage is flexible, enabling adjustments to match different market conditions or trading goals.
Trailing Stop (Dynamic Stop Loss):
A trailing stop mechanism is implemented using Fibonacci pivot levels. Once a position is open, the stop loss is dynamically updated as the price moves favorably. This ensures that profits are protected while minimizing losses in case of a sudden reversal.
Additional Features and Backtesting
Time Filtering (Backtesting):
The strategy includes a date range filter for backtesting. Users can define the start and end dates to evaluate the strategy’s performance during specific market periods, making it easier to assess its historical effectiveness.
Customizable Parameters:
Every indicator and risk management setting is fully customizable. This adaptability allows traders to tailor the strategy to different assets, timeframes, and market environments, ensuring optimal performance across diverse trading scenarios.
Conclusion
The Trend Hunter Scalping strategy effectively integrates multiple technical indicators to validate trends and manage risks efficiently. Its highly flexible, user-adjustable parameters make it adaptable to varying market conditions, providing traders with a robust framework for capturing quick trading opportunities.This strategy is designed to optimize both entry and exit points while offering comprehensive risk management controls.

PVSRA v5Overview of the PVSRA Strategy
This strategy is designed to detect and capitalize on volume-driven threshold breaches in price candles. It operates on the premise that when a high-volume candle breaks a critical price threshold, not all orders are filled within that candle’s range. This creates an imbalance—similar to a physical system being perturbed—causing the price to revert toward the level where the breach occurred to “absorb” the residual orders.
Key Features and Their Theoretical Underpinnings
Dynamic Volume Analysis and Threshold Detection
Volume Surges as Market Perturbations:
The script computes a moving average of volume over a short window and flags moments when the current volume significantly exceeds this average. These surges act as a perturbation—injecting “energy” into the market.
Adaptive Abnormal Volume Threshold:
By calculating a dynamic abnormal threshold using a daily volume average (via an 89-period VWMA) and standard deviation, the strategy identifies when the current volume is abnormally high. This mechanism mirrors the idea that when a system is disturbed (here, by a volume surge), it naturally seeks to return to equilibrium.
Candle Coloring and Visual Signal Identification
Differentiation of Candle Types:
The script distinguishes between bullish (green) and bearish (red) candles. It applies different colors based on the strength of the volume signal, providing a clear, visual representation of whether a candle is likely to trigger a price reversion.
Implication of Unfilled Orders:
A red (bearish) candle with high volume implies that sell pressure has pushed the price past a critical threshold—yet not all buy orders have been fulfilled. Conversely, a green (bullish) candle indicates that aggressive buying has left pending sell orders. In both cases, the market is expected to reverse toward the breach point to restore balance.
Trade Execution Logic: Normal and Reversal Trades
Normal Trades:
When a high-volume candle breaches a threshold and meets the directional conditions (e.g., a red candle paired with price above a daily upper band), the strategy enters a trade anticipating a reversion. The underlying idea is that the market will move back to the level where the threshold was crossed—clearing the residual orders in a manner analogous to a system following the path of least resistance.
Reversal Trades:
The strategy also monitors for clusters of consecutive signals within a short lookback period. When multiple signals accumulate, it interprets this as the market having overextended and, in a corrective move, reverses the typical trade direction. This inversion captures the market’s natural tendency to “correct” itself by moving in discrete, quantized steps—each step representing the absorption of a minimum quantum of order imbalance.
Risk and Trade Management
Stop Loss and Take Profit Buffers:
Both normal and reversal trades include predetermined buffers for stop loss and take profit levels. This systematic risk management approach is designed to capture the anticipated reversion while minimizing potential losses, aligning with the idea that market corrections follow the most energy-efficient path back to equilibrium.
Symbol Flexibility:
An option to override the chart’s symbol allows the strategy to be applied consistently across different markets, ensuring that the volume and price dynamics are analyzed uniformly.
Conceptual Bridge: From Market Dynamics to Trade Execution
At its core, the strategy treats market price movements much like a physical system that seeks to minimize “transactional energy” or inefficiency. When a price candle breaches a key threshold on high volume, it mimics an injection of energy into the system. The subsequent price reversion is the market’s natural response—moving in the most efficient path back to balance. This perspective is akin to the principle of least action, where the system evolves along the trajectory that minimizes cumulative imbalance, and it acknowledges that these corrections occur in discrete steps reflective of quantized order execution.
This unified framework allows the PVSRA strategy to not only identify when significant volume-based threshold breaches occur but also to systematically execute trades that benefit from the expected corrective moves.
