VWAP Gravity Oscillator (VGO) (Intraday Only)VWAP Gravity Oscillator (VGO)
The VWAP Gravity Oscillator (VGO) is an intraday analytical indicator designed to quantify price displacement from VWAP and the rate of change of that displacement.
The indicator models VWAP as a statistical equilibrium level and evaluates:
Price deviation from VWAP (Delta)
Momentum and acceleration of that deviation via MACD
This framework enables assessment of trend persistence versus mean-reversion pressure in intraday price action.
Methodology
VWAP Delta
Measures the signed distance between price and VWAP, representing directional bias relative to equilibrium.
MACD on Delta
Captures the first- and second-order dynamics of VWAP deviation, highlighting acceleration, deceleration, and potential inflection points.
Zero Line
Represents price–VWAP equilibrium. Crossings may indicate regime transitions.
Interpretation Guidelines
Positive Delta
Price is trading above VWAP with positive directional bias.
Negative Delta
Price is trading below VWAP with negative directional bias.
Increasing MACD
Expansion of VWAP deviation (trend reinforcement).
Decreasing or reversing MACD
Contraction of VWAP deviation (mean-reversion risk).
Intended Applications
Intraday trend validation
Early detection of trend exhaustion
Mean-reversion risk assessment
Filtering low-conviction or balanced market conditions
Implementation Notes
Designed exclusively for intraday timeframes
Automatically suppressed on higher-timeframe charts
Intended as a contextual analysis tool, not a standalone signal generator
Conceptual Summary
VGO evaluates whether price is diverging from, stabilising around, or reverting toward VWAP by analysing both displacement and its rate of change.
Vwaposcillator

VWAP Divergence | dobofulopOverview :
This script identifies potential bullish and bearish divergence signals using the Volume Weighted Average Price (VWAP). It calculates VWAP resets based on a selected “Anchor Period” (Session, Week, Month, Quarter, Year, Decade, Century, or corporate events like Earnings, Dividends, Splits). When price action and VWAP move in opposite directions with a sufficiently large ATR-based move over a chosen lookback period, the script plots divergence dots on the chart.
Key Features:
VWAP Anchoring : Choose an anchor period for resetting VWAP. This could be daily, weekly, monthly, or based on specific corporate events (Earnings, Dividends, Splits).
Divergence Detection : Looks for instances where the price is moving up while VWAP moves down (potential bullish divergence), and vice versa for bearish divergence.
ATR Filter : Uses the ATR (Average True Range) to filter out minor or insignificant price moves, helping to reduce noise.
Gap Check : Automatically invalidates signals if large price gaps occur within the lookback range.
Visual Signals : Bullish divergences are plotted below the bar, while bearish divergences are plotted above, making it easy to spot potential reversal zones.
How to Us
Inputs:
- Anchor Period (Session, Week, Month, etc.) – determines when the VWAP calculation restarts.
- Source (Default: HLC3) – Price source for the VWAP.
- ATR Multiplier and Lookback Period – Fine-tune the threshold for detecting significant moves vs. VWAP.
Interpretation:
- Bullish Divergence Dot: Suggests potential price strength when price moves higher but VWAP moves lower.
- Bearish Divergence Dot: Suggests potential price weakness when price moves lower but VWAP moves higher.
Disclaimer:
This script is provided for educational purposes only and should not be interpreted as financial advice. Past performance does not guarantee future results. Always conduct your own analysis and consider consulting a financial professional before making trading decisions.

VWAP with CharacterizationThis indicator is a visual representation of the VWAP (Volume Weighted Average Price), it calculates the weighted average price based on trading volume. Essentially, it provides a measure of the average price at which an asset has traded during a given period, but with a particular focus on trading volume. In our case, the indicator calculates the VWAP for the current trading symbol, using a predefined simple moving average (SMA) with a period of 14. This volume-weighted moving average offers a clearer view of the behavior of the VWAP and, of consequence of market dynamics.
One of the distinctive features of this indicator is its ability to provide a more "linear" representation of the data. This means that the data is "smoothed" to remove noise, allowing you to more easily identify the direction of the market trend. This smoother representation is especially useful because the financial market can be subject to significant fluctuations and volatility, and this indicator can help get a more stable view of the trend.
The indicator also offers a visualization of the market trend in a very intuitive way. Using an evaluation of the highs and lows of the last 10 days, determine whether the market is in an uptrend, downtrend, or no trend at all. To make this evaluation even clearer and more immediate, the indicator line is colored dynamically. When the trend is bullish, the line is blue, while in case of a bearish trend, it takes on a distinctive color, such as pink. If the trend is not defined, the line will be colored differently, for example light yellow. This coloration gives traders an immediate visual indication of the prevailing trend, allowing them to make more informed decisions regarding trading operations.
One potential strategy involves watching candles when they cross the VWAP line strongly. If, for example, a candlestick breaks above the VWAP line, we may look for retest areas near key support levels to gauge a potential long entry. In other words, we would consider that the price may have the potential to rise further after breaking above the VWAP line, and we would look to enter a long position to take advantage of this opportunity.
On the other hand, if a candlestick crosses below the VWAP line, we might consider looking for retest areas near the VWAP line itself, which now serves as potential resistance. This could indicate a possible short entry opportunity, as the price may struggle to break above the resistance represented by the VWAP line after breaking it down. In this case, we would look to take advantage of the expected continuation of the downtrend.
In both cases, the idea is to exploit significant movements across the VWAP line as signals of potential reversal or continuation of the trend. This strategy can help identify key entry points based on price behavior relative to the VWAP line.

VWOP: Volume Weighted & Oscillated PriceWhile playing around with the standard "ta.vwap" I wondered why there was no length input, so I did some research on what the underlying calculation actually is, and did my best to augment it so as to allow for a variable length based on an oscillator value.
Normal VWAP = (Number of Shares Bought x Typical Price) / Total Volume
In my VWOP Calculation, typical price is replaced by selected moving average type or "matype" and then multiplied by the volume.
Then a total value is calculated using math.sum with a length value that changes according to a selected oscillator's value. The total is then divided by
the sum of just volume using the same oscillating length value. Result is then passed through the selected"matype" once more to give the final result.
Indicator designed for use as a entry/exit indicator in conjunction with more traditional moving averages and/or signal filters. Useful for taking volume + an oscillator into account along with price, instead of just the price as with a simple moving average.

UV IndicatorUV Indicator (Ultimate VWAP Indicator) is using Volume Weighted Average Price to find Direction of the Trend, and Resistance & Support.
- Circle and Square shapes represent the point of Resistance and Support.
- Teal and Maroon background colors represent Uptrend and Downtrend of the Market.
- Numbers represent the Spread Percentages.

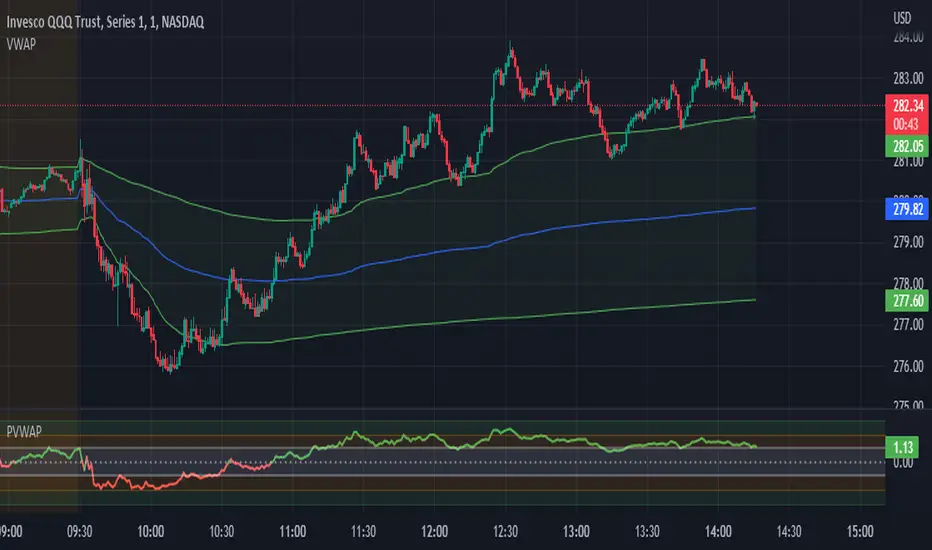
Candle Level of VWAP [By MUQWISHI]The " Price of Volume Weighted Average Price " (PVWAP) indicator calculates the VWAP standard deviation of bar price.
Features:
1. Ability to smooth the "Price of Volume Weighted Average Price" line.
2. Ability to choose the anchor period (timeframes).
Let me know if you have any questions.
Thanks.
Bogdan Ciocoiu - Sniper EntryWhat is Sniper Entry
Sniper Entry is a set indicator that encapsulates a collection of pre-configured scripts using specific variables that enable users to extract signals by interpreting market behaviour quickly, suitable for 1-3min scalping. This instrument is a tool that acts as a confluence for traders to make decisions concerning current market conditions. This indicator does not apply solely to an asset.
What Sniper Entry is not
Sniper Entry is not interpreting fundamental analysis and will also not be providing out of box market signals. Instead, it will provide a collection of integrated and significantly improved open-source subscripts designed to help traders speculate on market trends. Traders must apply their strategies and configure Sniper Entry accordingly to maximise the script's output.
Originality and usefulness
The collection of subscripts encapsulated in this tool makes it unique in the Trading View ecosystem. This indicator enables traders to consider entry positions or exit positions by comparing similar algorithms at once.
Its usefulness also emerges from the unique configurations embedded in the indicator's settings, which are different from those of the original scripts.
This indicator's originality is also reflected in how its modules are integrated, including the integration of the settings.
Open-source reuse
I used the following open-source resources, which I simplified significantly and pre-configured for short term scalping. The source codes for the below are already in the public domain, including the following links listed below.
www.tradingview.com (open source)
(open source and generic algorithm)
www.tradingview.com (open source)
(open source)
(open source)
www.tradingview.com (generic MA algorithm and open source)
(generic VWAP algorithm and open source)

RSI on VWAP Upgraded strategyFirst of all, the idea of apply RSI to VWAP was inspired by XaviZ; at least, that where I first saw that.
I simply applied the idea and searched for apply this on lower timeframe (M15) to increase the number of positions and improve the profit factor.
The conditions to enter are the same :
long : enter on RSI crossover oversold level
short : enter on RSI crossunder oversell level
To close position, I found a little change to apply :
long : close position when RSI(VWAP) went in overbought zone and crossunder the overbought level OR after being at least x bars in the overbought zone (parameter is 28 by default) => when the first condition happens
short : close position when RSI(VWAP) went in oversold zone and crossover the oversold level OR after being at least x bars in the oversell zone (parameter is 28 by default) => when the first condition happens
With this change, I got better results specially on BTCUSDTPERP (M15) where I reach a 6.8 profit factor with 119 trades closed. Not BAD !
The defaults parameters are the best found for BTCUSDTPERP (M15), but the strategy works fine for other pairs if you take time to find the rights combinations.
In this strategy you can change (with defaults in () ):
RSI length (28)
RSI overbought level (85)
RSI oversell level (30)
Number of bars before leaving as explain above (28)
The choice to take longs only, shorts only or both
The number of coin/token by position
The start date for backtesting
Please note that the script use a pyramiding parameter of 3 (can be changed in the first line of the script); that means that you can take up to 3 positions before closing. It lets you improve average enter price but increase the risk. 3 is the best I found to improve profit factor without expose myself too much.
This script would be better if automated because of the conditions of buy and sell.
It's only for educative purpose, not an advice to invest.
All my free scripts here : fr.tradingview.com
Leave a message and don't forget to follow me ;) !
