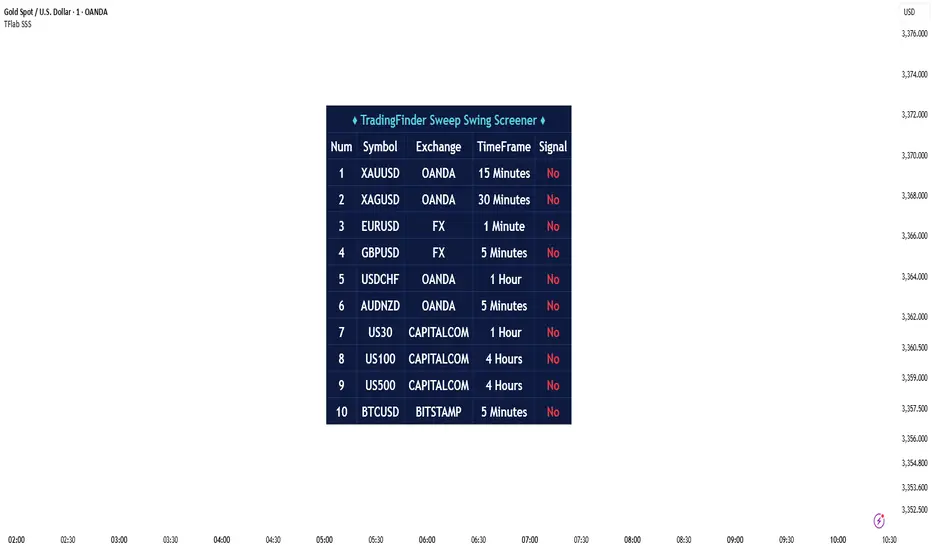
Sweep Swing Screener [TradingFinder]🔵 Introduction
Understanding how liquidity forms and how price reacts around key structural levels is essential for identifying precise, low-risk entry points. The Sweep Swing Screener is a specialized tool developed to continuously monitor market activity and detect liquidity sweeps, reaction zones, and valid confirmation candles across various trading instruments and timeframes.
This tool can be applied both to scan multiple symbols at once and to analyze all timeframes of a specific asset for potential reversal points. It begins by identifying a clear swing point, whether a swing high or a swing low, and then outlines a reaction zone between that level and either the highest or lowest value of the swing candle's open or close.
If the price revisits this zone, performs a liquidity grab, and prints an indecision candle like a doji or a narrow-bodied bar that closes within the zone, this may indicate a rejection of the level and the failure of a breakout attempt. At that moment, depending on the context, the screener may identify a bullish or bearish reversal and generate a corresponding Long or Short signal.
By emphasizing accurate entry timing, alignment with institutional order flow, and avoidance of common traps, this approach highlights market areas where liquidity engineering, reversal probability, and price inefficiency come together. As a result, the Sweep Swing Screener becomes a valuable part of any trader’s toolkit, particularly for those who rely on price action and liquidity logic to drive their decisions. It allows traders to focus on clean, actionable setups without getting lost in noise or misleading breakouts.
🔵 How to Use
The Sweep Swing Screener is designed to track market structure in real time and alert users when conditions for a potential reversal are present. Its methodology combines liquidity behavior with swing analysis and candle confirmation, all within predefined reaction zones.
To better understand this logic, consider a basic market flow where a swing high or low forms, followed by a return to that level. If the price sweeps the previous extreme and forms a confirming candle within the reaction zone, a signal is issued.
🟣 Long Signal
To identify a long setup, the screener looks for a valid swing low, often a level below which sell-side liquidity is likely to be clustered. Once found, it defines a reaction zone from the swing low to the lowest point between the candle’s open and close.
If the price returns to this area and creates a lower wick that extends beneath the swing low, the tool checks whether the price manages to close back inside the range, rejecting the breakdown. This indicates absorption of selling pressure and failure to sustain the move lower.
The screener then waits for a confirmation candle to appear. Typically, this is a doji or other small-bodied candle that closes inside the zone. If these conditions are met, the screener records a Long signal for that asset and, if enabled, sends a notification to alert the user.
🟣 Short Signal
For bearish setups, the screener begins by identifying a valid swing high, which usually marks a level where buy-side liquidity is concentrated. It then creates a reaction zone from the swing high to the highest point between the candle’s open and close.
When price returns to this level, sweeps above the swing high, and then fails to close higher, it may signal the presence of a bull trap and early exhaustion in the upward move.
A confirmation candle, usually a doji or a rejection bar that closes back within the zone, is then required. Once that occurs, the screener marks the asset with a Short signal and optionally sends a real-time alert to the user.
This type of setup helps highlight potential institutional sell zones, offering insight into where price is likely to reverse following a liquidity event.
🔵 Settings
🟣 Logical settings
Swing period : You can set the swing detection period.
Max Swing Back Method : It is in two modes "All" and "Custom". If it is in "All" mode, it will check all swings, and if it is in "Custom" mode, it will check the swings to the extent you determine.
Max Swing Back : You can set the number of swings that will go back for checking.
Maximum Distance Between Swing and Signal : The maximum number of candles allowed between the swing point and the potential signal. The default value is 50, ensuring that only recent and relevant price reactions are considered valid.
🟣 Display Settings
Table Size : Lets you adjust the table’s visual size with options such as: auto, tiny, small, normal, large, huge.
Table Position : Sets the screen location of the table. Choose from 9 possible positions, combining vertical (top, middle, bottom) and horizontal (left, center, right) alignments.
🟣 Symbol Settings
Each of the 10 symbol slots comes with a full set of customizable parameters :
Symbol : Define or select the asset (e.g., XAUUSD, BTCUSD, EURUSD, etc.).
Timeframe : Set your desired timeframe for each symbol (e.g., 15, 60, 240, 1D).
🟣 Alert Settings
Alert : Enables alerts for SSS.
Message Frequency : Determines the frequency of alerts. Options include 'All' (every function call), 'Once Per Bar' (first call within the bar), and 'Once Per Bar Close' (final script execution of the real-time bar). Default is 'Once per Bar'.
Show Alert Time by Time Zone : Configures the time zone for alert messages. Default is 'UTC'.
🔵 Conclusion
The Sweep Swing Screener provides a systematic method for identifying potential reversal zones by combining price structure, liquidity behavior, and candle-based confirmation. In markets that are often noisy and full of failed breakouts, focusing on these three elements helps clarify directional bias and supports more confident decision-making.
With the ability to scan multiple symbols and timeframes efficiently, this tool allows traders to stay focused on high-quality setups without the need to manually sift through dozens of charts. The inclusion of optional alerts further enhances its utility by offering timely updates when criteria are met.
By moving away from reactive strategies and toward structural anticipation, this screener supports traders who align their methods with institutional logic and the mechanics of smart money.
波浪分析
Dow Theory – Multi-Timeframe Multi Linear Regression Channel v5🎯 Why the Dow Theory Multi-Timeframe Was Born
Imagine a trader juggling a dozen charts just to answer a single question: “Where is price really going?”
Multi-timeframe analysis, while powerful, often feels like solving a puzzle with pieces scattered across screens. Drawing by hand adds another layer of chaos — every new line is a new opinion, not necessarily a new truth.
And that’s why this indicator was born — to make trend logic visible, objective, and automatic.
Dow Theory MTF is the chart’s own narrator. It scans multiple timeframes, detects real pivot structures, and draws clean, logical channels — no guesswork, no overload. Just clarity.
🧠 What Makes These Regression Channels Different
These channels don’t just trace price — they follow its footsteps with reason.
Forget smoothing techniques and fixed candle counts that behave like fortune-tellers in a thunderstorm. This indicator doesn’t assume — it detects.
No moving averages.
No candle-count bias.
Just pure High-Low logic, trend break confirmation, and regression lines that adjust to price volatility — whether you're trading lightning-fast spikes or molasses-slow consolidations.
It doesn’t just draw channels. It understands them.
It doesn’t just track trends. It proves them.
📦 What’s Inside?
📉 Secondary Trend
The dashed linear regression channel. Built from higher timeframe pivot highs/lows. Like the skeletal framework of a larger movement.
📈 Minor Trend
The solid-line regression channel using the same logic — zoomed in for tactical plays.
🔁 Dynamic Adaptive Linear Regression Channel (DALRC)
This one doesn’t show up unless it needs to. It appears only when secondary trends break. Think of it as the “emergency light” revealing when market structure fails — and where new opportunity sparks.
⏸ Sideway Zones (Consolidations)
Because not every market move is a trend.
Sideways ranges are detected when highs - lows cancel each other out — these zones become “traps” for liquidity, and are drawn as horizontal channels based on real pivot sequences (not arbitrary zones).
These are the calm before the storm — or the storm within the calm.
🕹 How to Use It
1. Breakout Entry Logic
Secondary trend breaks — a structural shift begins.
New trend forms — the indicator draws it.
Trap zones identified — price fails to make a higher high/lower low.
Minor trend taps the trap — pressure builds.
Minor trend breaks — confirmation.
💥 Enter the trade.
2. Trend-Following Logic
You’re within a valid intermediate trend.
Minor trend pulls back into trap zone (liquidity pool).
Minor trend breaks.
Ride the continuation.
3. Sideway Breakout Strategy
Price enters a sideways structure.
The indicator draws horizontal channels from real highs or lows sequences .
Wait for breakout beyond the top or bottom of this zone.
Confirm with minor trend alignment.
🚀 Enter on the breakout.
🧩 What It Actually Does (from the Code)
Detects highs lows structures from real high-timeframe price action.
Differentiates trending vs sideway conditions in real time.
Automatically draws:
Main trend lines.
Regression-based parallel channels.
Sideways zones with upper/lower bounds.
Detects trend break events and activates fallback logic (DALRC).
Deactivates and cleans up outdated channels and zones without redrawing manually.


WaveSurfer StrategyThis is a quant trading strategy that can be used to automate your trading. The first thing you will see in the settings popup is blocks where text can be entered. You can enter your automated trading messages here that will be sent to your exchange or third party application. Check with them to identify exactly how the buy and sell text should be configured. Put this {{strategy.order.alert_message}} in the alert message box and it will pull the buy and sell text from these settings boxes.
This trading strategy is designed to trade cryptocurrencies on the 1 hour timeframe. Other timeframes can be used but this is where I have found success. It uses a fairly complex algorithm to determine Long Buy and Sell opportunities. Each assets settings need to be optimized using back testing due to differences in volatility, volume, and risk. I provide optimized settings for the coins I trade here . As with any trading strategy, no amount of gains can be guaranteed. There is always risk of taking losses. Do not trade more than you are willing to lose.
The backbone of the strategy uses Bollinger Bands to measure the market trend. Bollinger Band Width(BBW) moves in waves. Waves over 0.2 are considered strong movements. Bollinger Band Percent(BB%) is used to determine wave direction, Bullish or Bearish. The strategy calculates BBW Slope and it is critical in determining status of the Bullish or Bearish wave. For example, if a strong Bullish wave is above 0.2 and slope is positive, this means to hold as the wave continues to accumulate gains. When slope turns negative, it is a signal that the wave is ending and opens more opportunities for the strategy to sell. Under certain conditions the waves can be considered neutral, especially when BBW is under 0.2.
BBW waves are given a score -5 through 5. These scores are used throughout the strategy to determine which Buy and Sell limits to use. Here is what the scores mean:
0 = Neutral, 1->3 = Beginning of Bullish wave, 4 = Strong Bullish wave, 5 = End of Bullish wave
0 = Neutral, -1->-3 = Beginning of Bearish wave, -4 = Strong Bearish wave, -5 = End of Bearish wave
During each of these trends the strategy offers different buy and sell opportunities that can be configured in settings. Hull moving averages are used for determining Buy/Sell crossovers and the Phase of the trade. The Phase of a trade if telling the strategy which Sell limits to use to determine when to sell. Phase 1 represents Bearish trend sell limits, Phase 2 represents Neutral trend sell limits, and Phase 3 represents Bullish trend sell limits. For example, if a Buy is triggered during a Bear trend, the trade will start in Phase 1. As the price moves up to Neutral within the Bollinger Bands it will move to Phase 2 and sell limits will move up. If price continues to rise into Bullish BBW trend it will change to Phase 3 and use Sell limits that will allow price to grow while the wave remains bullish.
Bearish Buys: Bearish Buys are designed to buy at a low peak. It uses Bollinger Band Mid line slope(Generally below -0.3), BB% very low(Generally below 0.0), and the trigger is RSI crossing up around 25-30. There are three different types of Bear Buys but they are all slight variations of this same technique. Again, all these settings need to be optimized using back testing. A more volatile coin will drop lower and with more intensity than a more stable coin. All Bear Buys will start in phase 1 with tight stop loss limits to protect against further drops. If prices does not recover quickly and moves sideways the sell limit will adjust(typically moving up) with each low pivot(assuming it is still above the original low that triggered the buy). There are also emergency sell options that can be configured.
Neutral Buys: Neutral Buys trigger when the Hull Moving Average crosses above the Bollinger Bands mid-point, generally want to use around 0.6. There is an option to buy only when BBW is below 0.2, meaning weak trend/Neutral. Neutral Buys will start with Phase 3 Sell limits.
Bullish Buys: There are a few different Bullish Buy options but these can be risky due to false breakouts which can result in higher losses if price reverses and drops quickly. All Bullish Buys start with Phase 3 Sell limits. One type of Bullish Buy is Level breakout. The recent high is always calculated using the pivot function and is displayed on the screen with the thick red dotted line. If you are using the Level buy option it will buy when the price breaks above this high level for consecutive candles. But the best bullish Buy option is Cycle Buy Late. This will buy when cycle crosses above 2, into Bull trend 3 or 4.
These examples shows the gold sell line adjust during the pivot and the Phase changes. It maintains decent gain even as price fails to move up in Phase 3. The thin yellow line is a Cycle Sell option that sells during cycles 5(Wave ending) and 0(Neutral). All these limits can be adjusted in settings:
This example shows Phase 3 sell limits allowing price to grow. The thin yellow line is an additional sell line that is higher than standard sell in this example but only triggers when Cycle is 5(wave ending) or 0(Wave Neutral):

Volatility-Adjusted Momentum Signal (VAMS)𝐕𝐀𝐌𝐒 | QuantumResearch
📈 Volatility-Adjusted Momentum Signal
A dynamic momentum engine fusing price action with volatility intelligence.
🧠 What is VAMS?
The Volatility-Adjusted Momentum Signal (VAMS) is an advanced oscillator built by QuantumResearch that integrates both price momentum and volatility momentum using dynamic Z-score normalization.
Unlike standard momentum indicators, VAMS adjusts to evolving market conditions by scaling thresholds in real time based on volatility. This allows traders to spot true trend strength and turning points with greater reliability.
⚙️ Key Components
📊 Z-Score Normalization: Measures how far price and volatility deviate from their rolling mean.
📈 Rate of Change (ROC): Adds trend acceleration insights to both price and volatility components.
🧮 Composite Z-Momentum (Z_total): A fusion of price and volatility signals.
🧾 Dynamic Thresholds: Bullish and bearish zones adjust based on the rolling standard deviation of the composite score.
🔍 Visual Features
🎨 Gradient-based histogram with bullish (teal), bearish (blue/pink), and neutral (gray) zones.
🧠 Auto-colored background to enhance visual detection of signal regimes.
📋 Real-time analytics table shows:
Z-score and ROC of price
Z-score and ROC of volatility
Current signal classification (Bullish / Bearish / Neutral)
📊 Performance Overview (Daily Timeframe)
BTC:
ETH:
ETH/BTC:
🔎 Why VAMS is Unique
✅ Blends momentum + volatility for dual-axis confirmation
✅ Uses Z-score math for better normalization across market phases
✅ Dynamic thresholding means it adapts in real time
✅ Built-in visual context (table + colored bars + backgrounds)
🧪 Technical Details
Works on any asset and any timeframe
⚠️ Disclaimer
This tool is for educational and research purposes only.
Past performance does not guarantee future results.
Always do your own research and risk assessment.

Keltner Channels with CirclesThis indicator, plots Keltner Channels on a price chart to identify volatility and potential breakout points. It calculates a moving average (EMA or SMA based on user input) as the basis, with upper and lower bands set at a multiple (default 2.0) of the Average True Range (ATR), True Range, or Range, adjustable via the BandsStyle input. Green circles appear above bars when the high touches or exceeds the upper band, and red circles appear below when the low touches or falls below the lower band, signaling potential overextension or reversal points. The channels and circles move with price action, aiding in dynamic trend analysis.

RSI + Fibonacci Bollinger BandsIn the current context of the cryptocurrency market, the search for effective trading strategies has become an imperative for investors. In this regard, developing completely new and innovative scripts in TradingView, with a high probability of profit, represents a stimulating challenge. The following is a proposed strategy that, while it may integrate existing elements of the TradingView ecosystem, establishes a distinctive and avant-garde approach to analyzing the price of Bitcoin against Tether (USDT).
The essence of this script lies in the combination of analytical tools that are not usually joined in common practice. One can start from traditional indicators, such as Bollinger Bands and the Relative Strength Index (RSI), but their implementation must be revisited to obtain an unprecedented result. Instead of using these indicators conventionally, it is suggested to create an adaptive divergence indicator that not only detects overbought or oversold conditions, but also adjusts its parameters based on the recent volatility of the market.
The proposal focuses on a system that uses a 50-period exponential moving average as a baseline, combined with Bollinger Bands to establish support and resistance levels. However, instead of simply observing the breaking of these bands, buy and sell signals would be implemented based on corroborations from the volatility-adjusted RSI. This approach would allow capturing trend changes more efficiently and with minimal delay in the execution of orders.
In addition, an alert system could be included that notifies the trader of divergences between the price and the RSI, which could increase the chances of anticipating crucial movements in the market. The implementation of this functionality would be carried out through the use of Pine Script version 6, which would guarantee optimized and modern code.
In conclusion, the creation of an innovative script for analyzing the price of Bitcoin against USDT in TradingView should focus on the development of synergistic strategies that transcend conventional methods. The combination of well-established indicators, adapted to the dynamic conditions of the market, can offer traders a valuable tool in their arsenal. Innovation, in this area, is essential to adapt to a constantly changing environment and maximize profit opportunities.


True Wave Trend [EWT]True Wave Trend
~~~~~~~~~~~~~~~~~~~~~~~~~~~~~~~~~~~~~~~~~~~~~~~~~~
Overview
True Wave Trend is a sophisticated, next-generation trend analysis tool designed to identify the start of new market trends with high precision. Inspired by the foundational principles of the Elliott Wave Principle, this indicator automatically detects the underlying 5-wave motive structures that signal a powerful shift in market direction.
The primary goal of this tool is to help traders spot potential trend changes early, filter out market noise, and align their strategies with the primary trend for more confident decision-making.
~~~~~~~~~~~~~~~~~~~~~~~~~~~~~~~~~~~~~~~~~~~~~~~~~~
How It Works
At the core of the Elliott Wave Principle is the idea that the market moves in repetitive, predictable patterns. The primary directional move, known as an motive wave, unfolds in a sequence of five distinct waves. These 5-wave patterns form the foundation of any strong, sustainable trend.
Our True Wave Trend indicator employs an advanced, proprietary pattern recognition algorithm to automatically identify these foundational 5-wave sequences on your chart.
When a valid bullish 5-wave impulse is completed, the indicator signals the start of a new uptrend.
Conversely, the completion of a bearish 5-wave impulse signals the beginning of a new downtrend.
By focusing on these core market structures, the indicator provides a clear and objective assessment of the trend, free from the ambiguity of traditional lagging indicators.
~~~~~~~~~~~~~~~~~~~~~~~~~~~~~~~~~~~~~~~~~~~~~~~~~~
Visual Features
The indicator is designed to be clean, intuitive, and easy to read directly on your chart.
Trend Background
The indicator paints the chart background to provide an at-a-glance view of the current market trend.
🟩 Light Green Background: A confirmed uptrend is in progress. This suggests the market is in a bullish phase.
🟥 Light Red Background: A confirmed downtrend is in progress. This suggests the market is in a bearish phase.
Swing Markers
The small triangles mark the key Swing Highs and Swing Lows. These are the pivotal turning points in price that serve as the building blocks for the indicator's wave analysis.
~~~~~~~~~~~~~~~~~~~~~~~~~~~~~~~~~~~~~~~~~~~~~~~~~~
How to Use This Indicator
This tool is best utilized as a primary trend-confirmation system.
Identify the Trend : Use the background color as your primary guide. A green background suggests looking for bullish opportunities (e.g., buying on pullbacks), while a red background suggests looking for bearish opportunities (e.g., selling on rallies).
Confirm with Other Tools : For optimal results, combine the signals from True Wave Trend with your existing trading strategy. Use it to confirm your analysis of support and resistance, moving averages, volume, or momentum oscillators like the RSI or Stochastics.
Risk Management : Always use proper risk management. The start of a new trend does not guarantee future price movement.
~~~~~~~~~~~~~~~~~~~~~~~~~~~~~~~~~~~~~~~~~~~~~~~~~~
Example of an Uptrend Signal
This chart shows the True Wave Trend indicator identifying the end of a downtrend and confirming the start of a new uptrend. After the background turns green, the price begins a sustained move higher.
Example of a Downtrend Signal
Here, the indicator detects a bullish trend losing steam and confirms a new downtrend. After the background turns red, traders could use this signal to manage long positions or look for shorting opportunities.
~~~~~~~~~~~~~~~~~~~~~~~~~~~~~~~~~~~~~~~~~~~~~~~~~~
Settings & Configuration
The indicator can be fine-tuned to fit your specific trading style and preferred timeframes.
Pivot Lookback Period
This is the most important setting for adjusting the indicator's sensitivity. It controls how the indicator defines a "significant" swing point.
A higher value makes the indicator focus only on major, long-term swing points. This results in fewer but more significant trend signals, ideal for swing or position traders.
A lower value makes the indicator more sensitive to short-term price swings, which may be more suitable for intraday or lower-timeframe trading.
Disallow wave 1 and wave 4 Overlap
This is a powerful filter for traders familiar with Elliott Wave theory. In a classic, strong impulse wave, "Wave 4" should not enter the price territory of "Wave 1". This setting enforces that strict rule.
When checked, the indicator will only signal a new trend if the underlying 5-wave structure is exceptionally strong and meets this "no-overlap" criteria. This can help filter out weaker, corrective patterns and focus only on the highest-quality trend signals.
When unchecked (default), the indicator uses a more flexible definition, allowing it to detect a wider range of trend-defining patterns.
~~~~~~~~~~~~~~~~~~~~~~~~~~~~~~~~~~~~~~~~~~~~~~~~~~
Disclaimer : This indicator is a tool for technical analysis and should not be considered financial advice. All trading involves risk. Past performance is not indicative of future results.

Dow Theory - AnchorTime Linear Regression Channel🧭 Dow Theory – AnchorTime Linear Regression Channel
Not moving. Not smoothing. Just anchored price structure from the point that matters.
Unlike traditional regression channels that constantly shift with every new candle, this indicator allows you to anchor your channel to a fixed historical time, letting you draw a stable trend channel that reflects the real structure of price since that exact point.
🚫 Why It Was Built:
No moving averages
No smoothing techniques
This ensures that you don't distort the structure when the market moves fast, slow, or with inconsistent volatility.
Traditional regression channels recalculate and slide continuously, making it nearly impossible to identify a reliable structure for breakout or long-term channel trading.
🎯 What It Does:
You choose an anchor time (e.g., a major pivot low or breakout).
The channel is drawn from that fixed point to now, using raw price data only.
Automatically adjusts upper/lower boundaries based on actual price deviation – not based on average noise.
🧱 Why It Matters in Dow Theory:
In Dow Theory, identifying major trends requires knowing where they started.
This tool helps you:
Lock in a structural starting point
Track channel integrity over long periods
Prepare for breakouts with full visual context
⚙️ Key Features:
Fully customizable slope calculation method (Close, OHLC, Median, Typical)
Dynamic buffer-based channel deviation
Static anchor = stable channel
Clean labels and clear visual hierarchy

Dow Theory - High Timeframe Linear Regression Channel🧭 Dow Theory – High Timeframe Linear Regression Channel
No moving averages. No smoothing. Just clean structure, drawn directly from price.
This indicator is built for serious price action traders who need to stay aligned with the true structure of the market - especially when volatility shifts or price moves in irregular waves. Unlike indicators that rely on moving averages or smoothed data, this tool is based purely on confirmed high-timeframe raw price movement.
⚙️ How It Works:
Detects highs and lows from your chosen higher timeframe (e.g., H1 or H4).
Draws real-time trendlines and parallel regression channels based on true price action — no smoothing involved.
When price closes beyond the channel, the indicator breaks the trend visually and structurally.
In sideways phases, it automatically draws clean horizontal boundaries to define consolidation zones.
❌ What It Doesn’t Do:
No moving averages
No exponential or weighted filters
No price smoothing
→ Which means no distortion when price moves with inconsistent speed or volatile ranges.
🌟 Key Features:
Trend-aligned trading made visual: Clearly see if structure is trending or ranging.
Auto break detection: Trendlines are removed once structure is invalidated.
100% price-based logic: No repainting, no lag.
Customizable visuals: Adjust timeframe, color, line style, and more.
🧪 Perfect For:
Traders who avoid lagging indicators and want real structure.
Systems that require clean, event-driven signals based on HTF behavior.
Navigating fast or irregular markets without being misled by artificial smoothing.

Dow Theory - Low timeframe Linear Regression Channel🔍 Dow Theory - Minor Trend: Linear Regression Channel for Low Timeframes
Catch Every Move. No Smoothing. No Delay. Pure Price Action.
This indicator redefines how you analyze minor trends on low timeframes by applying Dow Theory principles without relying on traditional smoothing techniques like moving averages. Instead, it maps trends using pure candle high and low points, capturing even the smallest structural shifts with surgical precision.
🧠 What Makes It Special?
Unlike traditional linear regression channels that smooth price across fixed windows (which often fail during high volatility or abrupt moves), this tool is built to react instantly, adapting to the true pulse of the market—the candle’s own highs and lows. The result: no lag, no distortion, and no compromise during fast, slow, wide, or tight market phases.
🧩 Core Functionalities:
Minor Trend Mapping: Automatically identifies and draws channels using candle-by-candle pivot detection (not swing highs/lows).
Adaptive Channel Drawing: Draws real-time parallel channels as soon as a valid trend structure is detected—uptrend, downtrend, or sideway range.
Break Detection Logic: Highlights when price breaks above or below the current channel to anticipate trend shifts.
Sideway Detection: Dynamically tracks contraction phases using overlapping pivot structures.
No Repainting: All lines are fixed and historical; what you see is what really happened.
Fully Customizable:
Change trendline colors for bullish, bearish, or sideway zones.
Adjustable line width and style (solid, dashed, dotted).
Toggle on/off channel lines for clarity.
💡 Why Use This?
If you’re tired of average-based indicators that get whipsawed in volatile markets, this is your surgical tool for clarity. Whether you’re scalping, building entry logic, or looking to automate setups—this indicator gives you the raw market structure in its cleanest, most responsive form.
ENJOY!


2ez MACD Scalper With TP&SL⚡ 2EZ MACD Scalper With TP & SL
The 2EZ MACD Scalper is a fast-execution intraday tool designed for traders who thrive on precision momentum shifts. Built around the core MACD histogram reversal logic, this script adds smart price structure filters, volatility-based TP/SL, and clean trade labeling—perfect for quick scalps on low timeframes.
📈 Core Features:
MACD Histogram Flip Entries
Detects key momentum shifts early for fast reaction scalps
Bullish/Bearish Structure Validation
Confirms valid market structure before triggering entries
Built-in TP/SL Logic
Uses ATR-based multipliers for dynamic risk control
Spacing Control
Avoids overtrading with customizable signal delay
Auto-Labeled Signals
Clean ▲ENTRY and TP/SL markers on chart for clarity
🔧 Customizable Inputs:
MACD (Fast/Slow/Signal)
ATR Length and Multipliers
Signal Spacing (Bars between signals)
Toggleable MACD Histogram display

2EZ Omega Indicator V3🧠 2EZ Omega Indicator V3
The 2EZ Omega V3 is a high-precision, multi-layered confluence system designed to generate elite-level BUY and SELL signals for trend traders and scalpers. Built from the ground up with advanced filtering and market condition detection, this version integrates dynamic market structure with smart volatility-based TP/SL plotting.
🔍 Core Signal Engine Includes:
WaveTrend Oscillator crossovers for momentum shifts
MACD Histogram Reversals to catch early trend moves
Kalman Filter for real-time directional smoothing
Heikin Ashi Supertrend logic to filter chop
RSI + Volume Spike Confluence for added entry strength
🎯 Smart Signal Logic:
A weighted score system evaluates all conditions to issue a signal only when at least 3 bullish or bearish conditions align, avoiding noise and increasing win consistency.
💹 Risk Tools Included:
Auto-calculated TP/SL levels using ATR-based volatility
Real-time position tracking with visual label alerts
Integrated alert system for Long & Short signals

2EZ-Deluxe⚙️ 2EZ-Deluxe
Precision Signal Engine | Refined Over Months of Development
2EZ-Deluxe is a next-generation confluence system crafted for traders who demand laser-accurate entries and dynamic trade management. Developed over months of continuous refinement, this advanced tool blends high-performance algorithms with adaptive market logic to deliver clean, decisive buy and sell signals—with clearly plotted take-profit and stop-loss targets.
What makes 2EZ-Deluxe truly elite is its layered synergy of high-level components:
🔹 Kalman Filter Direction – Smooth trend velocity estimator
🔸 Zero-Lag EMA (ZLEMA) – De-lagged trend detection for sharper responsiveness
🔹 Hull MA + Custom Gaussian Filter – Ultra-smooth directional logic
🔸 MACD Histogram Shifts – Early momentum shifts confirmed by volume
🔹 Heikin Ashi ATR Supertrend – Dynamic price structure tracking
🔸 ATR-based TP/SL plots – Auto-calculated targets based on current volatility
Each signal is filtered through a strict score-based system, ensuring only the most probable setups are triggered. Once alignment across all key filters is detected, a visual ENTRY label is shown, along with auto-drawn TP and SL lines—so you can act with confidence and clarity.
🛠️ Smart logic. Serious precision. Built for real-world trading.
2EZ-Deluxe is the evolution of signal systems—designed from the ground up with edge and efficiency in mind.


PO3 TNF💻Indicator Overview
The PO3 indicator combines Price Action analysis with multi-timeframe (MTF) Fibonacci analysis to identify:
Market trends (bullish/bearish)
Key support and resistance levels
Weekly and monthly price targets
Optimal entry and exit points
🌟 Key Features
Smart Trend Identification:
Uses "mother candles" to determine the primary trend
Visual signals at trend reversals (green/red triangles)
Dynamic Fibonacci Levels:
Automatic Fibonacci extensions on trend changes
Customizable level colors
Multi-Timeframe Dashboard:
Trend analysis across 3 timeframes (daily/weekly/monthly)
Trend reversal points for each timeframe
Advanced Target System:
Weekly and monthly price targets
Target achievement tracking (color change when hit)
Clear Trading Signals:
Buy/sell triangles at trend reversals
EMA crossover confirmations
Asterisk (*) marks on strong candles
⚙️ Customizable Settings
Color Customization: For all indicator elements
Display Control: Toggle visibility of:
Trend lines
Fibonacci levels
Breakout lines
Trend cloud
Dashboard Customization:
Text sizing and positioning
Timeframe activation
🎯 How to Use
Primary Trend:
Green: Bullish trend (buy opportunities)
Red: Bearish trend (sell opportunities)
Trading Signals:
Green ▲ triangle below candle: Buy signal
Red ▼ triangle above candle: Sell signal
Asterisk above/below candle: Strong candle confirmation
Fibonacci Levels:
Orange (L1): Entry point
Green (T1,T2,T3): Price targets
Red (L0): Stop loss level
Target Dashboard:
Automatic weekly/monthly targets
Blue highlight when targets are achieved

