Anytime Plot 100EMA/1h for Bitcoin [akubi] Ver.2 常時1時間足100EMAを表示常時1時間足100EMAを表示してくれるインジケーターです。
仮想通貨、特にBTCペアの通貨は1時間の100EMAがレジスタンス&サポートとして意識されています。
仮想通貨をされる方は常時出しておきたいインジケーターの一つだと思います。
===============
以前あったものの改良版です。
・名称の変更
・合成シンボルにも対応
ということで、新規で投稿します。
===============
XBTUSD

デイトレーダー・FXBTCのための「常時1時間足の100EMA(指数平滑移動平均線)を表示するインジケーター」デイトレーダーにとって、
とりわけFXBTCトレーダーにとって、
1時間の100EMA(指数平滑移動平均線)はとても大事なツールです。
なぜなら、ビットコインの相場では
1時間足の100EMAが必ずといっていいほど意識されているからです。
「だからどんな時間足を見ている時でも、この移動平均線だけは注視していたい!」
そんな方にオススメしたいEMAが、この 「『1時間100EMA』インジ」 です。
このインジケーターは、1分足から最大12時間足まで、
どの時間足を開いていても、常に1時間足の100EMAが表示されます。
つまり、
どの時間足に注目しようが、常に1時間足の100EMAを意識できるのです。
シンプルですが、
かゆいところに手が届くインジケーターなのです\(^o^)/
ぜひ、お気に入りインジケーターの1つとして使ってみてください。
それでは、また!

Turtles Modified AlertsAlerts for famous Turtle Trading Rules. Based on work from tmr0 and ossettia . It can be used with Autoview.
If you have any advice on how to further improve the script, please let me know by PM or comment below. Thanks!
Please hit on "Like" if you find this script useful so that others can find it easier. Thanks!
*** The information and script provided here are no recommendation to buy or sell. They are just an idea for educational and discussion purposes. ***

Stochastic RSI Signal LinesThis script is for private use only. I created it as step 1 for my Renko Trading Strategy.
Tested on BitMex on XBTUSD.

SMA Serial for Crypto Day Trade Fixed Length SSCDTENCrypto market is different from other financial markets
This indicator plot SMA series that fits Crypto, esp BTCUSD, XBTUSD
Good for 5m - 1H time period for Day Trading.
Specific SMA can be toggle on/off
---------- Française ----------
Le marché de la crypto-monnaie est différent des autres marchés financiers
Cet indicateur série SMA qui correspond à Crypto-monnaie, en particulier BTCUSD, XBTUSD
Bon pour 5m - 1H période pour le day trading.
SMA spécifique peut être activé / désactivé
---------- 中文 ----------
加密货币市场与其他金融市场不同
该指标绘制了适合加密货币的SMA系列,特别是BTCUSD,XBTUSD
适合5分钟 - 1小时 日间交易时间段。
特定SMA可以打开/关闭
----------日本語----------
暗号通貨市場は他の金融市場とは異なります
この指標は、暗号通貨、特にBTCUSD、XBTUSD用のSMAシリーズを描画します。
5分から1時間の取引期間に適しています。
特定のSMAをオン/オフにすることができます
---------- Disclaim ----------
Before using this indicator, you acknowledge that you have read and accepted that this indicator is for research purpose only and it does NOT provide any investment nor trading signal.
Users should make their own decisions, carefully assess risks and be responsible for their own investment and trading activities.


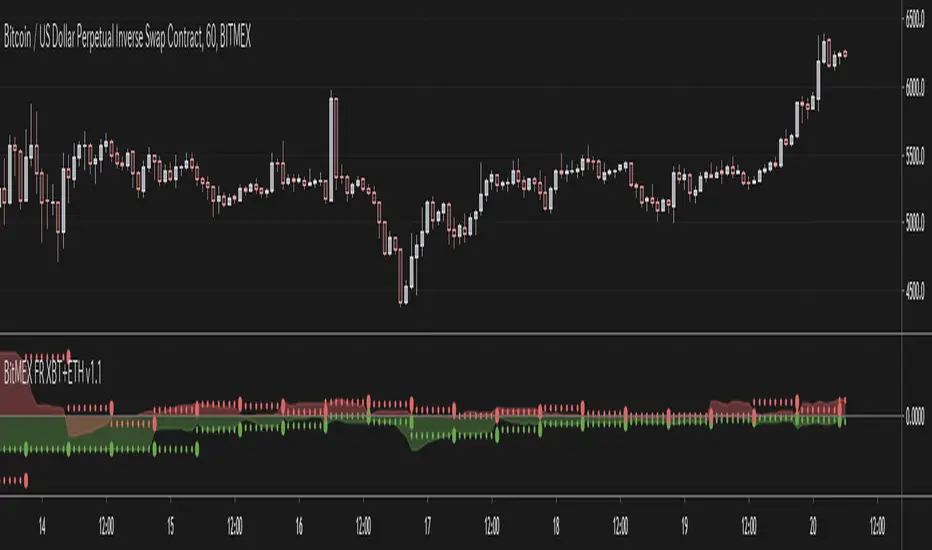
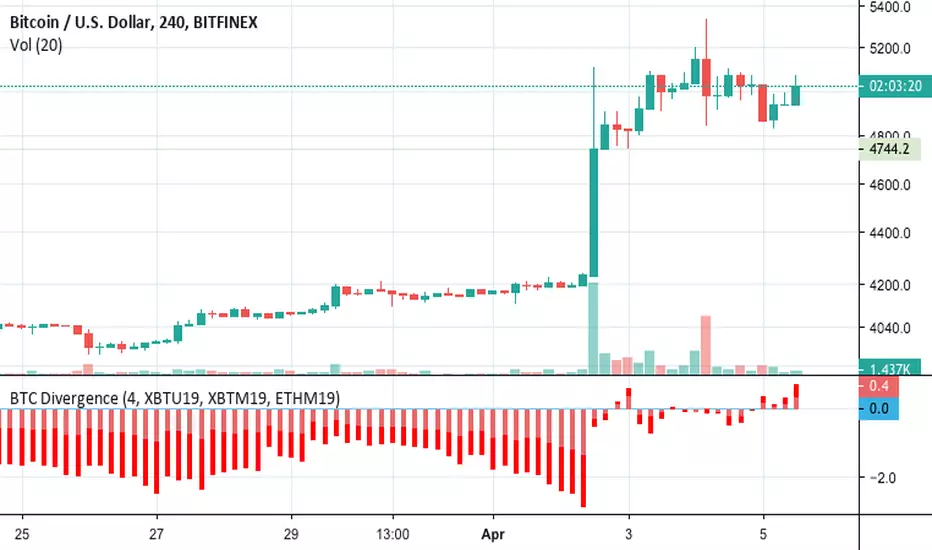
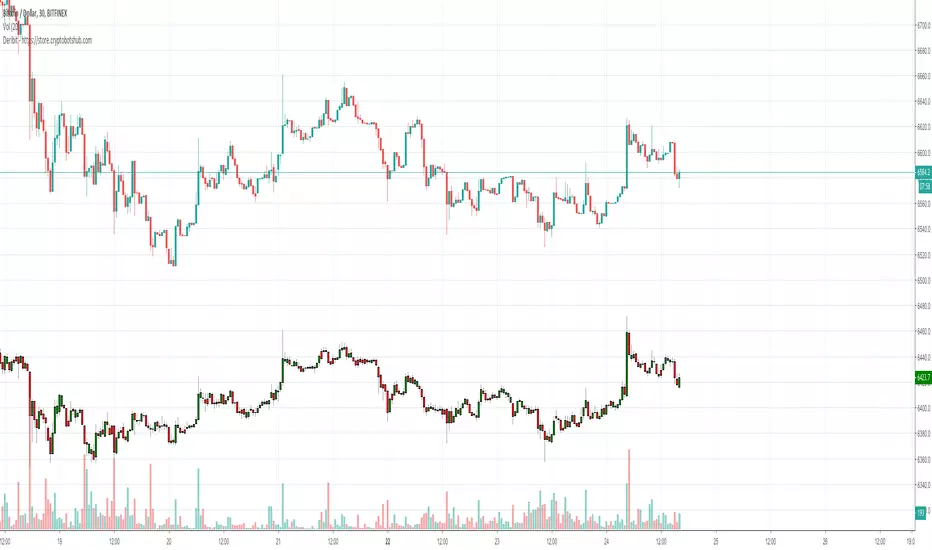
BTC Futures Divergence Monitor 1.0BITFINEX:BTCUSD
BTC Futures Divergence Monitor 1.0
=======
# Abstract
This script shows the divergence between BTC futures price and BTC actuals price of bitFlyer FX and BitMEX in percentage .
Usually, when people bought it or sold it too much on futures, the divergence between actuals and futures are getting expanding.
I believe this is really useful to find when the conversion of the trend happens.
Also supports ETH and USDT divergence too. If you wish to enable USDT mode, please check "Show only USDT divergence (Poloniex)" on the settings menu.
Enjoy :)
# Supports:
- bitFlyer FX (blue)
- BitMEX BTC Futures 3mo (orange)
- BitMEX BTC Futures 6mo (red)
- BitMEX ETH Futures (purple)
- USDTUSD (Poloniex)
# Disclaimer:
This is a free script. Feedbacks are welcome! But I don't have any responsibility when this script has broken or something went wrong.
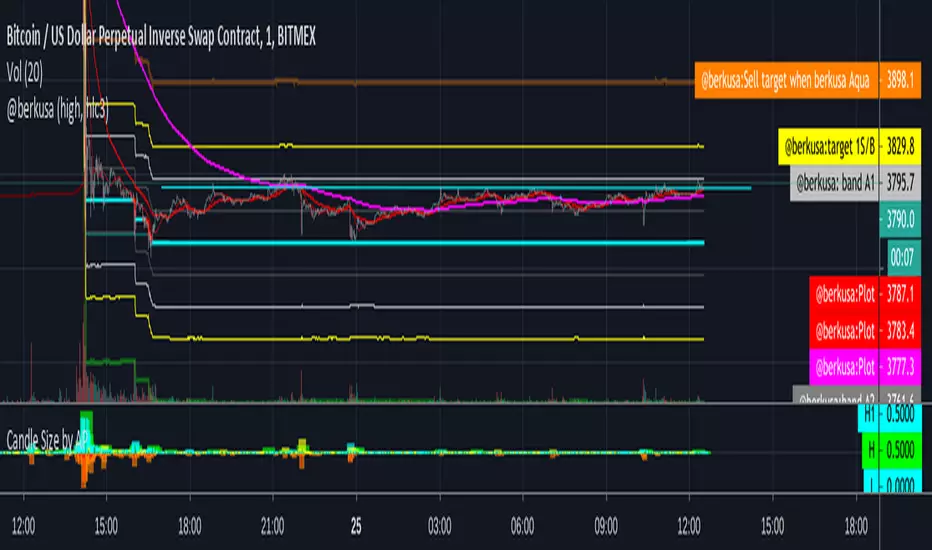
@berkusa buy sell bands 1m 5 m 15mshort term buy sell zone
let me know if you like it on telegram @berkusa
TJ Money FlowTJ Money Flow, one of the most frequently used indicators by me.
This indicator is a modification of the CMF and it has great use and multiple interpretation possibilities.
I like treating it like the addition of StochRSI to RSI, just that TJ-MoneyFlow works like a "behind the scenes tool" of the volume indicator.
The first most important thing about it are the spikes. I like seeing a movement either up or down, confirming it with a spike in the TJ-MF.
The next sparkle about it is the modification of movements down and movements up.
When it moves down, it is in blue color, when it moves up it is in green color.
This lets me compare the candle direction to the Money Flow direction.
Bigger clouds of the same color indicate strength in the direction.
One more step that I like using the TJ-MoneyFlow for is for divergences. Either divergences on a cloud itself, regardless from its color.
Or divergences over two separate clouds. The idea is, if there is a significant trend, then it should be confirmed by the MoneyFlow.
Like and Follow me and you will find this page interesting because I am a TA expert and professional day trader in crypto since 2012 that does daily updates and new posts about the hottest and most discussed coins.
Cheers, TJ

TJ-StochFinally I am setting this beast free.
This is one of my favorite indicators and it has everything what there is to Stochastic and Stochastic RSI.
The TJ-Stoch is a heavy mod and merge of Stochastic and Stochastic RSI.
There are some very important modifications on it.
- The green and red line at 40 and 90 points.
The stochastic lines like getting rejected at both lines.
A rejection at the 40 point line, from above or from below, mostly has an impulse move to it.
The same applies to the 90 point line.
The 90 point line nevertheless, has mostly an impulse move, when it is getting crossed down.
The stochastic lines staying above the 90 point line, are an indication for upcoming impulse moves.
- The lines itself
The stochastic lines have their original colors; blue for K , the faster moving line and orange for D the slower moving line.
Nevertheless, you can identify the original colors only, when those are ascending.
When the K and the D line are descending, those turn red, so you can immediately see what move is what and where it is actually descending or ascending.
- The crosses
One of the most important treats that Stochastic and Stochastic RSI have, are the crossovers. Sometimes these are hard to identify.
Therefore, a crossover is marked with a green cross at the top. A cross-down is marked with a red cross at the top.
Like and Follow me and you will find this page interesting because I am a TA expert and professional day trader in crypto since 2012 that does daily updates and new posts about the hottest and most discussed coins.
Cheers, TJ

XBT Fader [NeoButane]Proof of concept indicator. Intended usage: to create confidence in buying a dump, or selling a pump. This is not a trending tool.
It works by monitoring spikes in volume as well as abnormally ATR. Generally speaking, bitcoin reverses every time there's a one candle spike with no following volume. There is a limit in which a signal is triggered in case bitcoin continues running. Other preventive measures include a modified MFI and fairy dust.
In future iterations, take profits and stop losses will be implemented also based upon average candle percentage move rather than ATR.

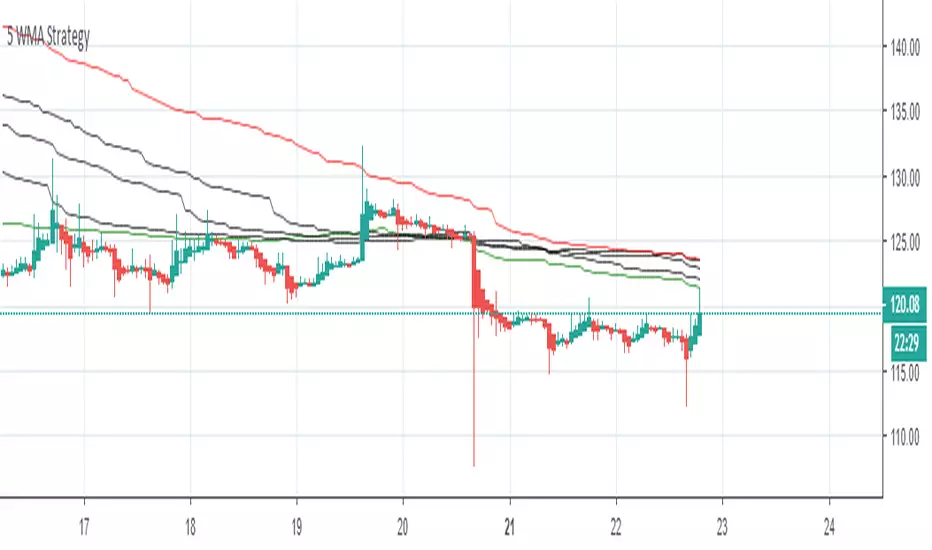
5 Weighted Moving Averages Strategy for Trend Analysis This indicator was made to allow Five WMA to be displayed without needing to use up 5 charting indicators individually
This is best Indicator for Support and Resistance, If GREEN line is on TOP market Bullish
If RED line is on Top Market is Bearish ,
Entry and Exit place Long and Short orders on Lines According to Trend
For more info contact : rohitworkss@gmail.com
CCI Highlighted & Divergence Signals [CryptoProSignal]>> This is the updated version of my previous ' CCI Highlighted ' indicator/oscillator (checkout in my previous published scripts) .
> > Whats new :
> This version of CCI highlighted has integrated divergence signals to spot various divergences on any timeframe which ultimately saves your time rather than
spotting divergences by manual analysis. Thus making it CCI Highlighted & Divergence Signals indicator/oscillator.
> By default it is optimised to give you divergence signal whenever CCI Length1 is above 100 or below -100 but you can always enable all divergences in
setting/format by simple check/uncheck.
> Tag reference in indicator/oscillator :
* Tag "R" refers to Regular divergence.
* Tag "H" refers to Hidden divergence.
----------------------------------------------------------------------------------------------------------------------------------------------------------------------
----------------------------------------------------------------------------------------------------------------------------------------------------------------------
***Below is the description copy pasted from my previous version of CCI Highlighted for remaining functionality of this updated indicator/oscillator.***
>> This script is purely based on Commodity Channel Index ( CCI ) with multiple CCI instances being used within one oscillator.
>> User can use as much as 5 CCI instances/plot within one oscillator.
> How to use :
1. When Bullish :
Whenever CCI length 14 crosses above -100(negative 100) that means bullish momentum is supported.
Best bullish/long entry would be when CCI length 14 crosses above -100(negative 100) as mentioned above and at the same time CCI length
200 is bouncing on top of +100(positive 100).
2. When Bearish :
Whenever CCI length 14 crosses below +100(positive 100) that means bearish momentum is supported .
Best bearish/short entry would be when CCI length 14 crosses below +100(positive 100) as mentioned above and at the same time CCI length
200 is bouncing at bottom of -100(negative 100) .
> Color Clarity :
a. Bullish support is highlighted GREEN and bearish support is highlighted RED within the oscillator background with respect to
Length 1 (i.e 14 by default) .
b. PURPLE is highhighted when Length 5(i.e 200 by default) is bouncing either on top of +100(for bullish ) or at bottom of -100(for bearish ).
c. AQUA is highlighted when Length 3(i.e 50 by default) is bouncing on top or at bottom of 0 from either side respectively.
d. Best entry in both cases i.e bullish or bearish as mentioned above('How to use') is highlighted WHITE by default.
> Tip:
Just observe the color outputs on any timeframe in a chart as it works fractally on every timeframe , it will help you understand better with
clarity.
> You are always free to experiment with the CCI lengths, change highlighted color and hide/unhide the Lengths as per your requirements in
setting/format .

FOMO_Buy_Sell_Indicator_BasicFOMO Buy Sell Indicator (Basic Version)
Inexpensive alternative to FOMO (Full Version), best for those who wish to use FOMO but with limited functionalities.
Features
-> Conventional FOMO
-> Multiple EMAs
Doesn't Include
-> Short Term/Mid Term/Long Term Trade Signals
-> Holy Trend Line
-> Options to change parameters inside FOMO.

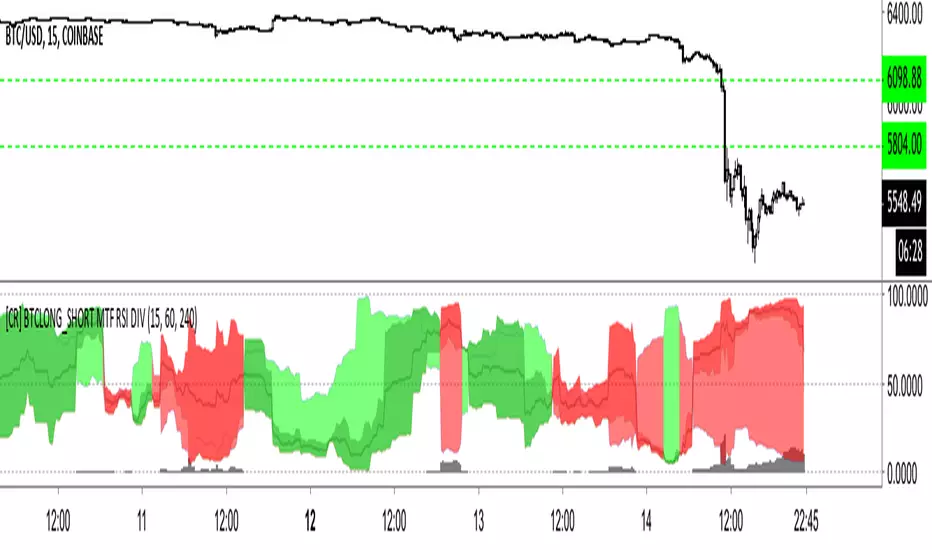
[CR] BTCLONG_SHORT MTF RSI DIVComparing BTCLONG and BTCSHORTS RSI on BITFINEX
+MTF
+RSI
+Difference
Simple indicator to show long/short contract association, including relative difference.

[CR] BTCLONG_SHORT MTF RSI DIV+ MTF x 3 BTCSHORT and BTCLONG on BITFINEX RSI
+ SHORT vs LONG RSI + Difference
This indicator demonstrates the difference between BTCLONG and BTCSHORT values on BITFINEX and compares their relative difference also in RSI.
Red = SHORT > LONG
Lime Over Green = LONG > SHORT difference RSI greater than LONG vs SHORT RSI.
Red Over Darker Red = SHORT > LONG difference RSI greater than SHORT vs LONG RSI.
Black trend line = Total SHORT/LONG RSI
Grey Columns = Total RSI / Difference RSI
Deribit ChartsCurious what the price is on Deribit and can't wait for the new charts to be posted on TradingView? This gives you an overlay of their price bars based upon how they calculate their derivative.
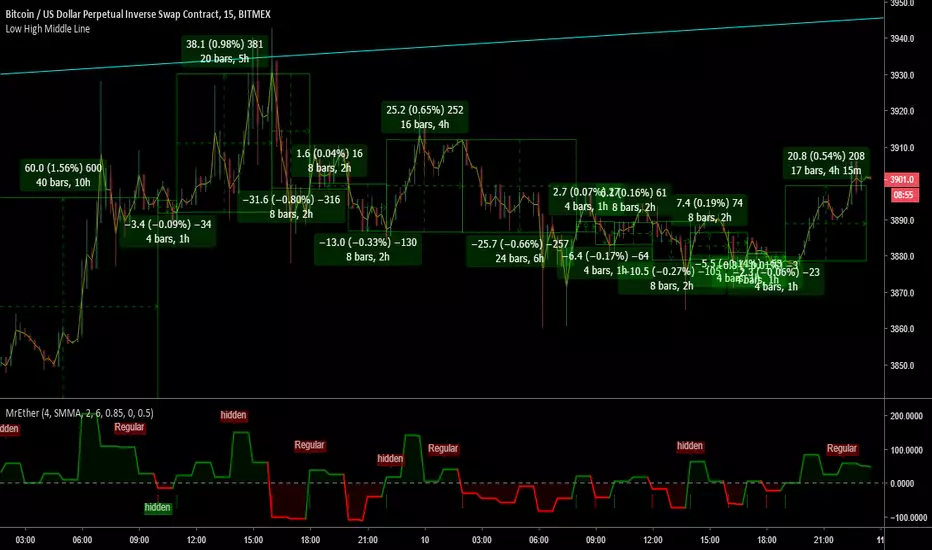
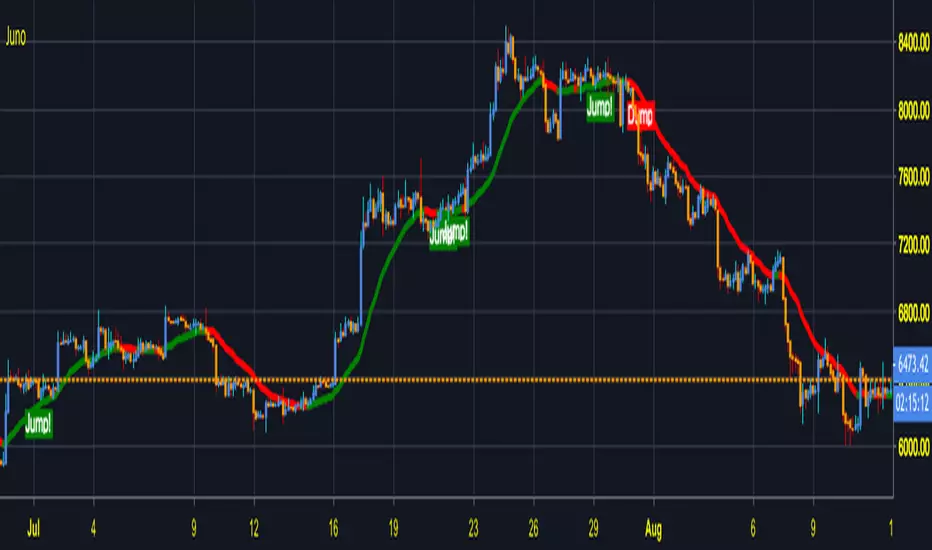
Juno ReactorJuno Reactor Its a Indicator base on Accumulation Distribution Method
What u can expect ? JUNO REACTOR REACTION !!! This indicator its perfect for those who like adrenaline and Leverage in Bitmex XBT
wont be many signals to Trade for long time frames but the ones u have will be EPIC !!!
If u want more Signals just go to smaller time frame But Strategy best result its at 3H ,
Calculating The Volume the Hidden Orders and Regular & Hidden Divergence to find the perfect setup before a BIG JUMP TO THE MOON!!
Initial Capital from February of 2017 of 100$
Netprofit 1 Million%
Backtest Calculate without Leverage
Strategy 3h TimeFrame Backtest
i68.tinypic.com
i64.tinypic.com
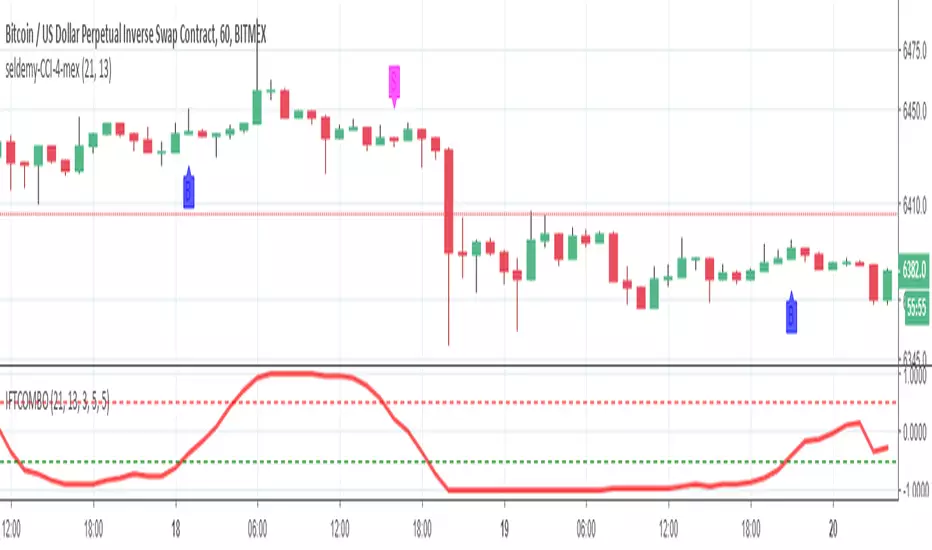
Seldemy-CCI-for-Auto4mexThis is the script I used in BITMEX for auto trading XBTUSD using great Chrome extension called Auto4mex . Default settings are good for 1h candle nowadays (September October 2018 period for Bitcoin). If more volatility comes adjusting needed. Enjoy !