進階日內圖表類型
運用磚形、卡吉、新價線和點數圖的日內功能強化您的分析能力。
日內時間範圍適合短期交易者,以及尋求精確進出點的交易者。
內容:
什麼是日內圖表
在交易中,「日內」一詞指的是在單一交易日內發生的價格波動。TradingView超級圖表提供各種預設的日內時間區間供您探索:
- 秒:1, 5, 10, 15, 30, 45
- 分鐘:1, 3, 5, 15, 30, 45
- 小時:1, 2, 3, 4
這四種類型的圖表是以價格為基礎的圖表 — 當您選擇其中一種日內區間時,這些值會用來計算價格變動並調整圖表,但它們仍不是以時間為基礎的圖表。
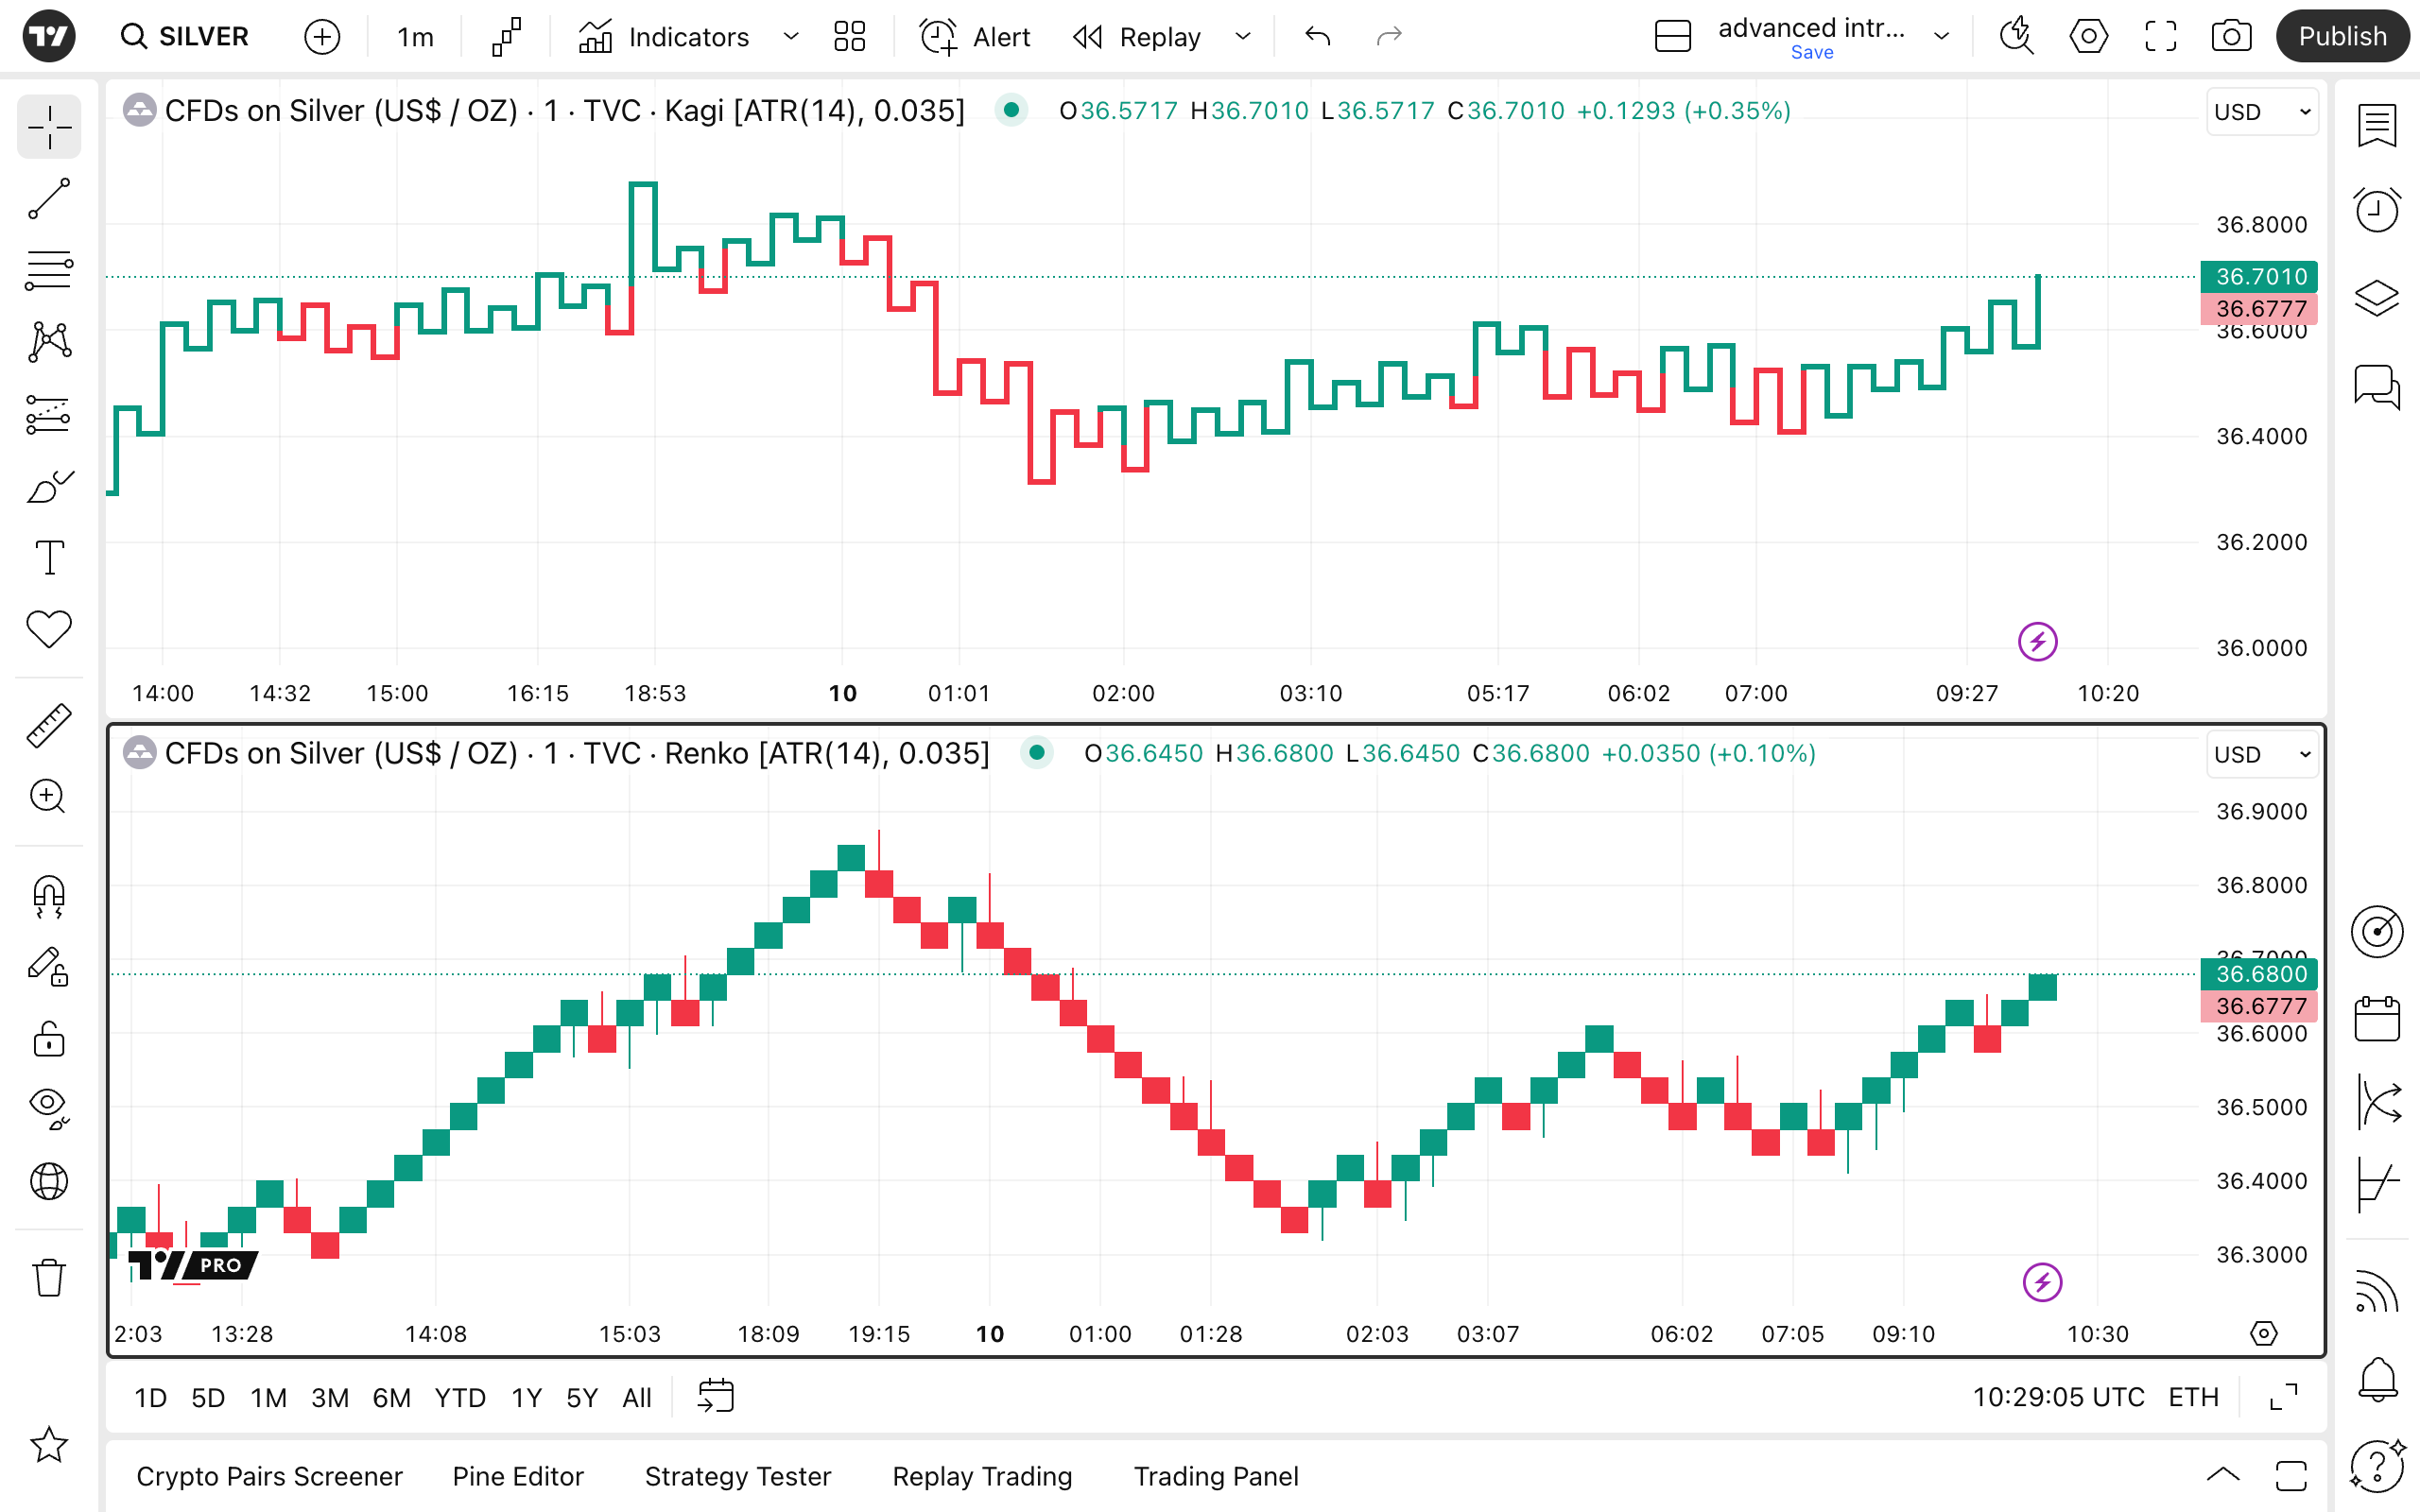
磚形圖
在日語中,「renga(レンガ)」的意思是「磚塊」。
這種類型的圖表會以連續的矩形(磚塊)來顯示價格走勢。每一塊磚都是根據預先設定的價格變動單位來繪製的。例如:當價格移動達到指定的數值後,圖上就會出現一塊新的磚塊 — 這與K線圖完全相反,K線圖是在固定時間週期後才產生新的一根。

卡吉圖
這是另一種以價格為基礎的圖表,只考慮價格變動。與磚形圖略有不同的是,卡吉圖不會畫出新的圖形單元,而是持續延伸現有的線條,直到價格方向發生改變。
在卡吉圖中,垂直線代表價格的變動,水平線則表示價格方向的改變。線條的顏色則根據新線的收盤價與前一條線的收盤價之間的關係來決定。
新價線圖
這種圖表類型會在價格在上升趨勢中創出更高高點,或在下降趨勢中創出更低低點時,繪製出新的圖形。
在這類圖表中,只有當價格變動足夠強烈時,才會顯示趨勢反轉。

點數圖
這種圖表在1900年代初期曾風靡一時,現在正重新受到關注。它們由「X」和「O」組成,當價格波動達到預定幅度時,就會出現這兩個圖形。

還有一件事要記住…
即使這些圖表類型使用相似的輸入資料,且都有一個共同目標 ─ 減少時間在計算中的影響。
但有一點請特別留意: 這四種圖表類型不僅適用於盤中交易,您可以搭配任何時間週期使用,依據自己的交易風格自由調整。
此外,如果您是做盤中交易,也可以自訂時間週期,找出最符合您策略的設定。
要在交易中達成目標,請深入了解其他圖表類型 ─ 每一種都是為了配合您獨特策略而設計的。
另請閱讀: