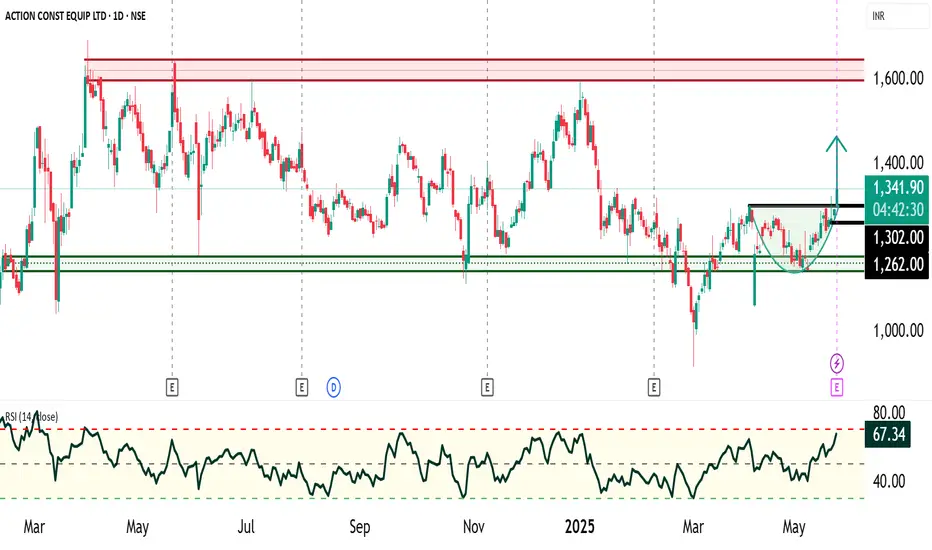
ACE Construction Ltd has been consolidating in a broad sideways range between ₹1,150 to ₹1,600 since February 2024. The price action has clearly defined support and resistance levels, with ₹1,150–₹1,200 acting as a strong accumulation zone and ₹1,550–₹1,600 serving as a firm resistance, where selling pressure consistently emerges.
Technical Pattern Observed (Hourly Timeframe): A Rounding Bottom pattern has been identified on the hourly chart, which is a bullish reversal pattern, indicating a shift from bearish to bullish sentiment.
Neckline Breakout Level: ₹1,300 (confirmed)
Breakout Confirmation: Price closed above neckline with volume support
Target Estimation (Measurement Rule):
Stop Loss: ₹1,260 (last swing high before breakout, risk-managed level)
Momentum & Trend Indicators:
Fundamental Context: ACE Construction Ltd remains **fundamentally strong** with robust financials and growth visibility. The current price level provides an **attractive valuation**, further supporting the bullish technical setup.
Conclusion: The current technical setup presents a high-probability bullish opportunity in ACE Construction Ltd. The completion and breakout of the rounding bottom pattern, supported by bullish momentum indicators and favorable valuation, make a strong case for upward price movement towards ₹1,450–₹1,550 in the near term.
Technical Pattern Observed (Hourly Timeframe): A Rounding Bottom pattern has been identified on the hourly chart, which is a bullish reversal pattern, indicating a shift from bearish to bullish sentiment.
Neckline Breakout Level: ₹1,300 (confirmed)
Breakout Confirmation: Price closed above neckline with volume support
Target Estimation (Measurement Rule):
- Target 1: ₹1,450
- Target 2 (Final): ₹1,550
Stop Loss: ₹1,260 (last swing high before breakout, risk-managed level)
Momentum & Trend Indicators:
- Multi-EMA Bullish Crossover: Multiple exponential moving averages have aligned in a bullish formation, signaling trend continuation.
- Relative Strength Index (RSI): Currently above 60, reflecting strengthening momentum and buyer dominance.
Fundamental Context: ACE Construction Ltd remains **fundamentally strong** with robust financials and growth visibility. The current price level provides an **attractive valuation**, further supporting the bullish technical setup.
Conclusion: The current technical setup presents a high-probability bullish opportunity in ACE Construction Ltd. The completion and breakout of the rounding bottom pattern, supported by bullish momentum indicators and favorable valuation, make a strong case for upward price movement towards ₹1,450–₹1,550 in the near term.
免責聲明
這些資訊和出版物並非旨在提供,也不構成TradingView提供或認可的任何形式的財務、投資、交易或其他類型的建議或推薦。請閱讀使用條款以了解更多資訊。
免責聲明
這些資訊和出版物並非旨在提供,也不構成TradingView提供或認可的任何形式的財務、投資、交易或其他類型的建議或推薦。請閱讀使用條款以了解更多資訊。