Flag and pole patterns
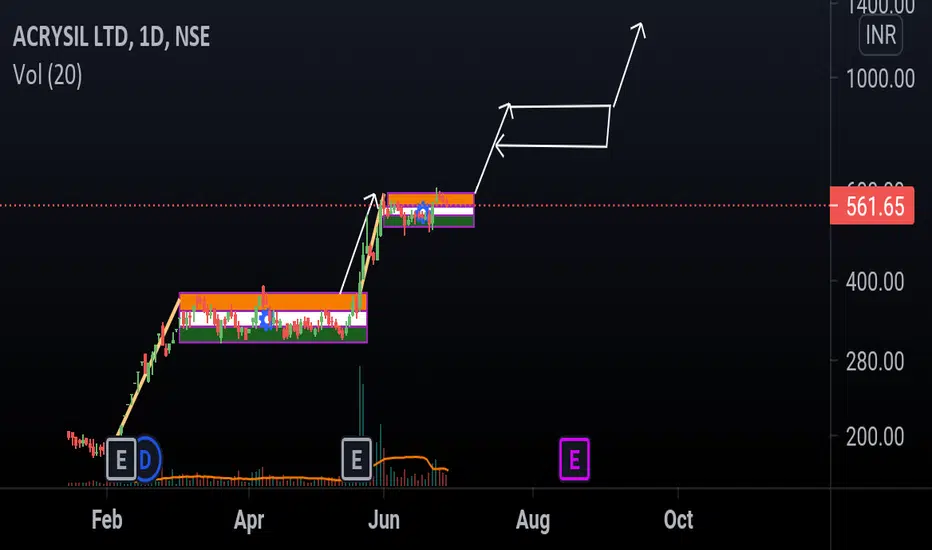
This chart is for representation purposes only. It shows how price action is formed in a very bullish market structure. A rally is followed by a consolidation phase and price don't fall to a great extent during this phase. Profits are booked and new hands are ready to grab it and again a surge is seen.
免責聲明
這些資訊和出版物並非旨在提供,也不構成TradingView提供或認可的任何形式的財務、投資、交易或其他類型的建議或推薦。請閱讀使用條款以了解更多資訊。