🔄 When Time Speaks, Price Listens
#TimeAnalysis | #Cardano | #ADAUSDT | #SmartTrading
In my previous ADA/USDT analysis, the mistake wasn’t in the price structure—it was in the timing.
The price didn’t reverse where expected, not because the setup was wrong, but because I ignored one critical factor:
The time cycle must align with the price cycle.
📌 Here's what really happened:
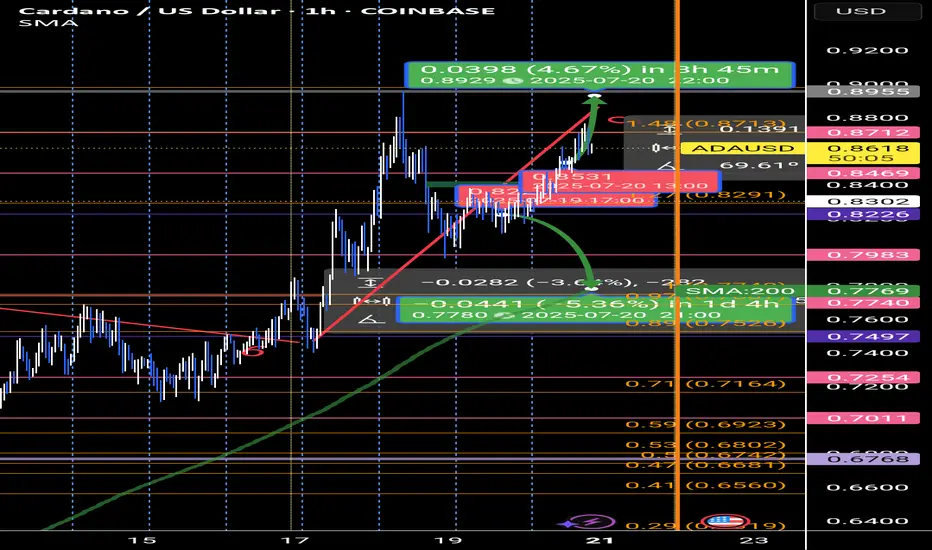
From July 2 to July 7, price moved sideways in a clear accumulation range.
Then came an explosive expansion wave (Wave 3) from 0.573 to 0.75, lasting 113 hourly candles.
This was followed by a correction wave (Wave 6) of 130 candles.
Currently, price is in a distribution wave (Wave 9), ongoing for over 90 candles.
📉 My error? Misalignment between time and price.
📆 After applying my fixed monthly time cycle model, based on the rule that 9 marks the end of every cycle,
it became obvious that the price waves were following exact temporal intervals:
➡️ Monthly cycle anchor points:
(8 Jan, 7 Feb, 6 Mar, ..., 9 Sep, 8 Oct...)
Each month is divided into 3 major time zones, and each zone into two sub-zones.
This creates a clean framework where waves naturally unfold:
🔹 3 = Expansion
🔹 6 = Correction
🔹 9 = Distribution
💡 Key Takeaways:
Don’t trade predictions. Trade the wave.
Every price move is governed by time.
Ignoring time leads to premature entries—even with solid technical analysis.
🧠 Want to learn how to read these time-price cycles? Let’s discuss in the comments.
#TimeAnalysis | #Cardano | #ADAUSDT | #SmartTrading
In my previous ADA/USDT analysis, the mistake wasn’t in the price structure—it was in the timing.
The price didn’t reverse where expected, not because the setup was wrong, but because I ignored one critical factor:
The time cycle must align with the price cycle.
📌 Here's what really happened:
From July 2 to July 7, price moved sideways in a clear accumulation range.
Then came an explosive expansion wave (Wave 3) from 0.573 to 0.75, lasting 113 hourly candles.
This was followed by a correction wave (Wave 6) of 130 candles.
Currently, price is in a distribution wave (Wave 9), ongoing for over 90 candles.
📉 My error? Misalignment between time and price.
📆 After applying my fixed monthly time cycle model, based on the rule that 9 marks the end of every cycle,
it became obvious that the price waves were following exact temporal intervals:
➡️ Monthly cycle anchor points:
(8 Jan, 7 Feb, 6 Mar, ..., 9 Sep, 8 Oct...)
Each month is divided into 3 major time zones, and each zone into two sub-zones.
This creates a clean framework where waves naturally unfold:
🔹 3 = Expansion
🔹 6 = Correction
🔹 9 = Distribution
💡 Key Takeaways:
Don’t trade predictions. Trade the wave.
Every price move is governed by time.
Ignoring time leads to premature entries—even with solid technical analysis.
🧠 Want to learn how to read these time-price cycles? Let’s discuss in the comments.
免責聲明
這些資訊和出版物並不意味著也不構成TradingView提供或認可的金融、投資、交易或其他類型的意見或建議。請在使用條款閱讀更多資訊。
免責聲明
這些資訊和出版物並不意味著也不構成TradingView提供或認可的金融、投資、交易或其他類型的意見或建議。請在使用條款閱讀更多資訊。