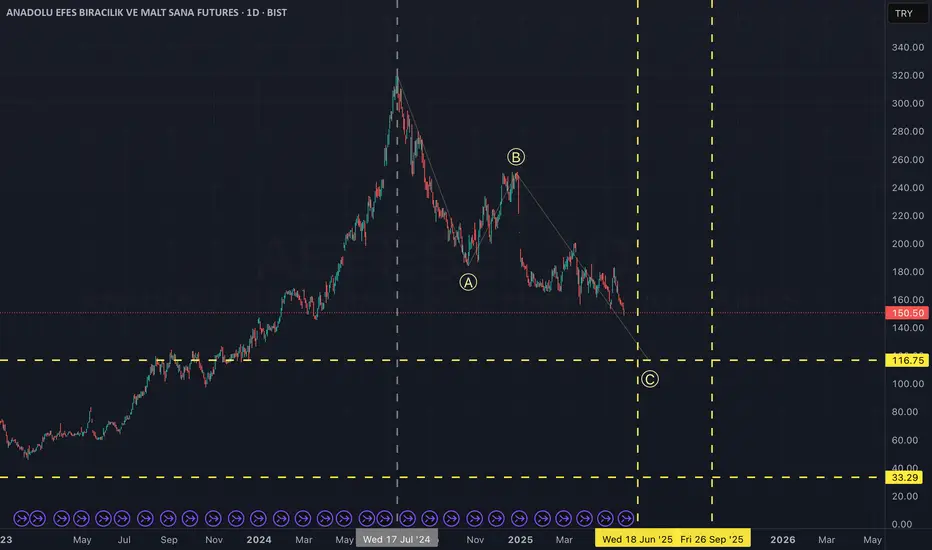
Ee observed an all-time high on July 17, 2025. Since then, the market appears to be undergoing an ABC corrective pattern. Based on the wave structure and proportions, it seems we are currently in the final leg of this correction.
Two potential target zones, both in terms of price and timing, are marked with yellow lines on the chart. In my view, there is a high probability that the correction will conclude before June 18. However, if the final leg deepens further than expected, the completion of this corrective phase could be extended into September.
Two potential target zones, both in terms of price and timing, are marked with yellow lines on the chart. In my view, there is a high probability that the correction will conclude before June 18. However, if the final leg deepens further than expected, the completion of this corrective phase could be extended into September.
交易進行
Since the chart on May 29, with the latest wave starting to take shape, I'm updating the potential reversal zones as shown in the chart. While the gray areas are less probable zones, it's still worth keeping an eye on them.免責聲明
這些資訊和出版物並非旨在提供,也不構成TradingView提供或認可的任何形式的財務、投資、交易或其他類型的建議或推薦。請閱讀使用條款以了解更多資訊。