🧠 Double Top Breakdown on  AER
AER
Ticker: AerCap Holdings N.V. (AER)
Timeframe: 1D (Daily Chart)
Pattern: Double Top
Strategy: Bearish Reversal
✍️ Analysis
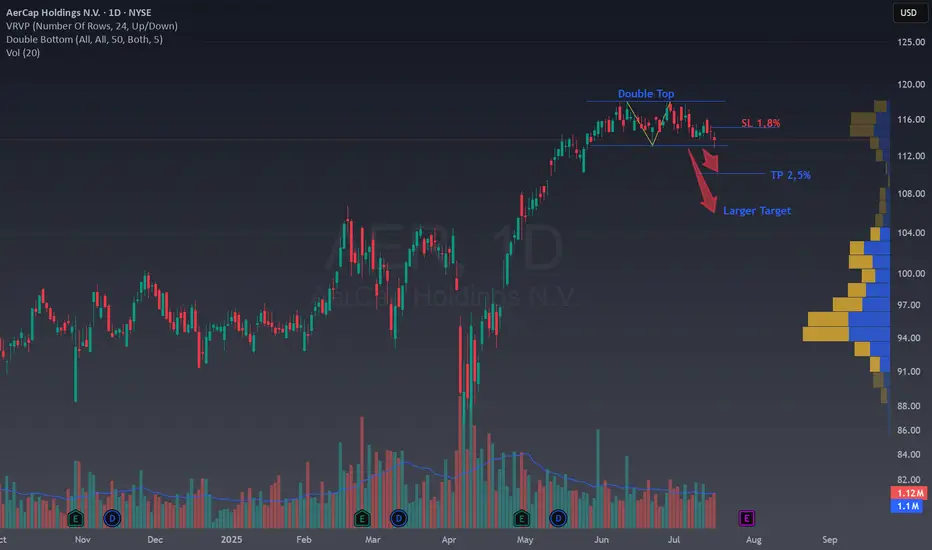
We’ve got a textbook Double Top forming after a strong bullish rally. Price failed to break above the $118 resistance twice, forming the classic M-shape. The neckline is around $113.50, almost broken.
This setup is supported by:
✅ Clean pattern structure
✅ Volume Profile (VPVR) shows a low-volume gap below current price
✅ Good Risk/Reward structure
🎯 Trade Setup
Entry: Below $113.50 (neckline break)
Stop Loss: Above $115.50 (1.8% risk)
Take Profit 1: Around $110 (2.5% target)
Larger TP target: $106 – matches VPVR high-volume node and pattern projection. It's also a Fibo retracement level of 38,2% of the rally.
📘 Educational Notes
This is a great example of how a Double Top can signal the end of a bullish trend (at least temporary) and the start of a pullback or reversal. The volume gap below may accelerate the move. Managing risk with a tight SL and scaling out at TP1 and TP2 is key here.
💬 What do you think? Are you seeing the same setup on your end?
👍 Hit the rocket if you found this useful and follow for more clean technical setups!
Ticker: AerCap Holdings N.V. (AER)
Timeframe: 1D (Daily Chart)
Pattern: Double Top
Strategy: Bearish Reversal
✍️ Analysis
We’ve got a textbook Double Top forming after a strong bullish rally. Price failed to break above the $118 resistance twice, forming the classic M-shape. The neckline is around $113.50, almost broken.
This setup is supported by:
✅ Clean pattern structure
✅ Volume Profile (VPVR) shows a low-volume gap below current price
✅ Good Risk/Reward structure
🎯 Trade Setup
Entry: Below $113.50 (neckline break)
Stop Loss: Above $115.50 (1.8% risk)
Take Profit 1: Around $110 (2.5% target)
Larger TP target: $106 – matches VPVR high-volume node and pattern projection. It's also a Fibo retracement level of 38,2% of the rally.
📘 Educational Notes
This is a great example of how a Double Top can signal the end of a bullish trend (at least temporary) and the start of a pullback or reversal. The volume gap below may accelerate the move. Managing risk with a tight SL and scaling out at TP1 and TP2 is key here.
💬 What do you think? Are you seeing the same setup on your end?
👍 Hit the rocket if you found this useful and follow for more clean technical setups!
免責聲明
這些資訊和出版物並不意味著也不構成TradingView提供或認可的金融、投資、交易或其他類型的意見或建議。請在使用條款閱讀更多資訊。
免責聲明
這些資訊和出版物並不意味著也不構成TradingView提供或認可的金融、投資、交易或其他類型的意見或建議。請在使用條款閱讀更多資訊。