🔍 Market Context:
- AEVO/USDT is currently showing signs of a bullish reversal after reaching a low point.
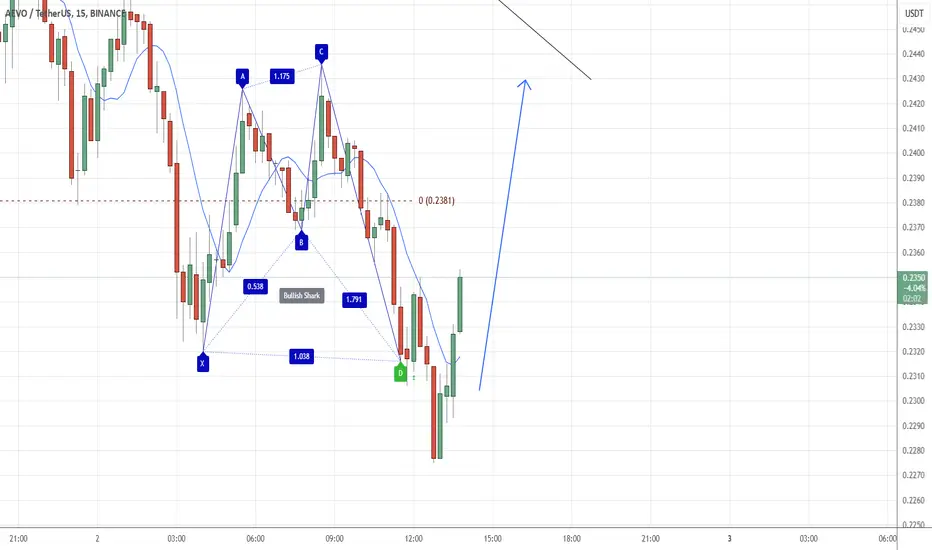
- The price has bounced from a key support level, near the 0.2320 area, forming a potential bullish shark pattern.
- Fibonacci retracement levels and previous price action suggest resistance zones to watch above.
📊 Trade Entry Criteria:
- The price has reacted strongly at the 0.2320 support, with a sharp upward movement forming a potential bullish pattern.
- A bullish confirmation is expected if the price breaks above 0.2345 resistance, continuing the upward move.
- A rejection from the resistance could result in a retest of the lower levels.
🎯 Trade Targets & Risk Management
- Bullish Scenario:
- Entry Price: Above 0.2345 USDT
- Take Profit (TP1): 0.2380 USDT (38.2% Fibonacci)
- Take Profit (TP2): 0.2400 - 0.2420 USDT (50%-61.8% Fibonacci)
- Stop Loss (SL): Below 0.2320 USDT
- Bearish Scenario:
- Entry Price: Below 0.2320 USDT (break of support)
- Take Profit (TP1): 0.2300 USDT (27.2% Fib extension)
- Take Profit (TP2): 0.2270 USDT (61.8% Fib extension)
- Stop Loss (SL): Above 0.2345 USDT
📉 Profit Target Justification:
- The bullish target aligns with key Fibonacci retracement levels and a previous liquidity zone.
- The bearish target is supported by Fib extensions and the possibility of further downside if support breaks.
📌 Summary
✔ Price is at a key support level, suggesting a potential bullish move.
✔ Fibonacci confluence provides clear trade setups for both bullish and bearish scenarios.
✔ Risk-to-reward ratio is favorable in both directions.
🔻 Invalidation: If price breaks below 0.2320 USDT, bullish setups are invalid. Conversely, a strong move above 0.2345 USDT would invalidate bearish setups.
- AEVO/USDT is currently showing signs of a bullish reversal after reaching a low point.
- The price has bounced from a key support level, near the 0.2320 area, forming a potential bullish shark pattern.
- Fibonacci retracement levels and previous price action suggest resistance zones to watch above.
📊 Trade Entry Criteria:
- The price has reacted strongly at the 0.2320 support, with a sharp upward movement forming a potential bullish pattern.
- A bullish confirmation is expected if the price breaks above 0.2345 resistance, continuing the upward move.
- A rejection from the resistance could result in a retest of the lower levels.
🎯 Trade Targets & Risk Management
- Bullish Scenario:
- Entry Price: Above 0.2345 USDT
- Take Profit (TP1): 0.2380 USDT (38.2% Fibonacci)
- Take Profit (TP2): 0.2400 - 0.2420 USDT (50%-61.8% Fibonacci)
- Stop Loss (SL): Below 0.2320 USDT
- Bearish Scenario:
- Entry Price: Below 0.2320 USDT (break of support)
- Take Profit (TP1): 0.2300 USDT (27.2% Fib extension)
- Take Profit (TP2): 0.2270 USDT (61.8% Fib extension)
- Stop Loss (SL): Above 0.2345 USDT
📉 Profit Target Justification:
- The bullish target aligns with key Fibonacci retracement levels and a previous liquidity zone.
- The bearish target is supported by Fib extensions and the possibility of further downside if support breaks.
📌 Summary
✔ Price is at a key support level, suggesting a potential bullish move.
✔ Fibonacci confluence provides clear trade setups for both bullish and bearish scenarios.
✔ Risk-to-reward ratio is favorable in both directions.
🔻 Invalidation: If price breaks below 0.2320 USDT, bullish setups are invalid. Conversely, a strong move above 0.2345 USDT would invalidate bearish setups.
免責聲明
這些資訊和出版物並不意味著也不構成TradingView提供或認可的金融、投資、交易或其他類型的意見或建議。請在使用條款閱讀更多資訊。
免責聲明
這些資訊和出版物並不意味著也不構成TradingView提供或認可的金融、投資、交易或其他類型的意見或建議。請在使用條款閱讀更多資訊。