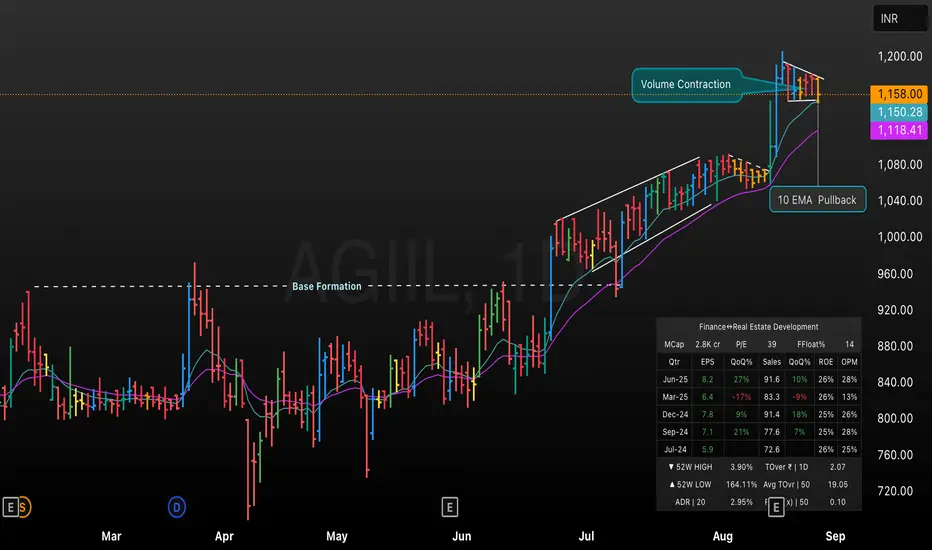
This TradingView chart showcases AGIIL’s technical progression from a prolonged base formation to a strong breakout phase, supported by notable volume contraction and a textbook 10 EMA pullback. Key chart highlights include identification of base formation, a rising price channel, and consolidation with EMA support. The volume contraction and recent price pullback to the 10 EMA reflect a healthy setup typically seen before sustained upward movement, making AGIIL a candidate for breakout trade strategies. Core metrics such as market cap, EPS growth, 52-week range, and liquidity are also visually summarized for quick reference.
免責聲明
這些資訊和出版物並不意味著也不構成TradingView提供或認可的金融、投資、交易或其他類型的意見或建議。請在使用條款閱讀更多資訊。
免責聲明
這些資訊和出版物並不意味著也不構成TradingView提供或認可的金融、投資、交易或其他類型的意見或建議。請在使用條款閱讀更多資訊。