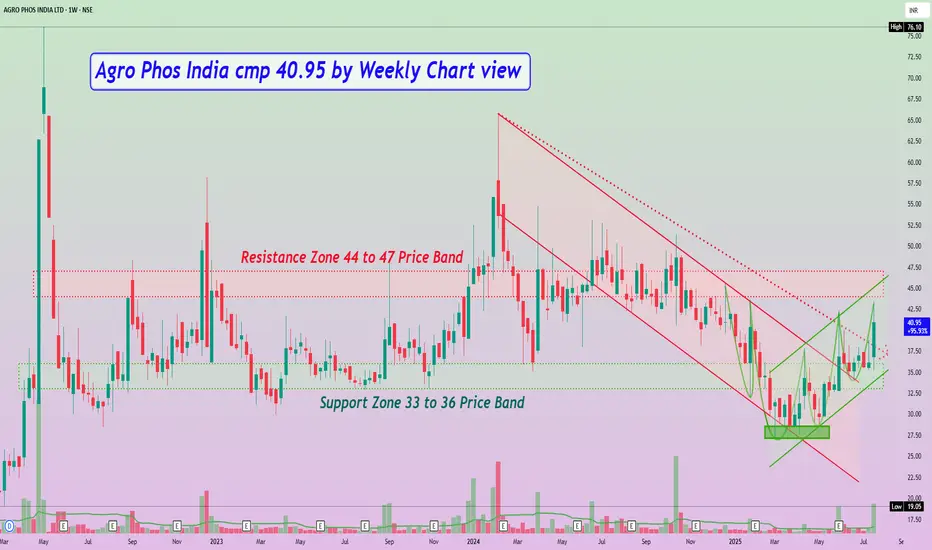
Agro Phos India cmp 40.95 by Weekly Chart view
- Support Zone 33 to 36 Price Band
- Resistance Zone 44 to 47 Price Band
- Falling Price Channel Breakout has well sustained
- Falling Resistance Trendline Breakout too is maintained
- Bullish Double Bottom "W" by repeat Bullish Rounding Bottoms
- Rising Price Channel momentum steadily taking a gradual uptrend
- Volumes have surged heavily over the week above avg traded quantity
- Most common Technical Indicators BB, EMA, MACD, RSI, SAR seen turning positive
免責聲明
這些資訊和出版物並非旨在提供,也不構成TradingView提供或認可的任何形式的財務、投資、交易或其他類型的建議或推薦。請閱讀使用條款以了解更多資訊。
免責聲明
這些資訊和出版物並非旨在提供,也不構成TradingView提供或認可的任何形式的財務、投資、交易或其他類型的建議或推薦。請閱讀使用條款以了解更多資訊。