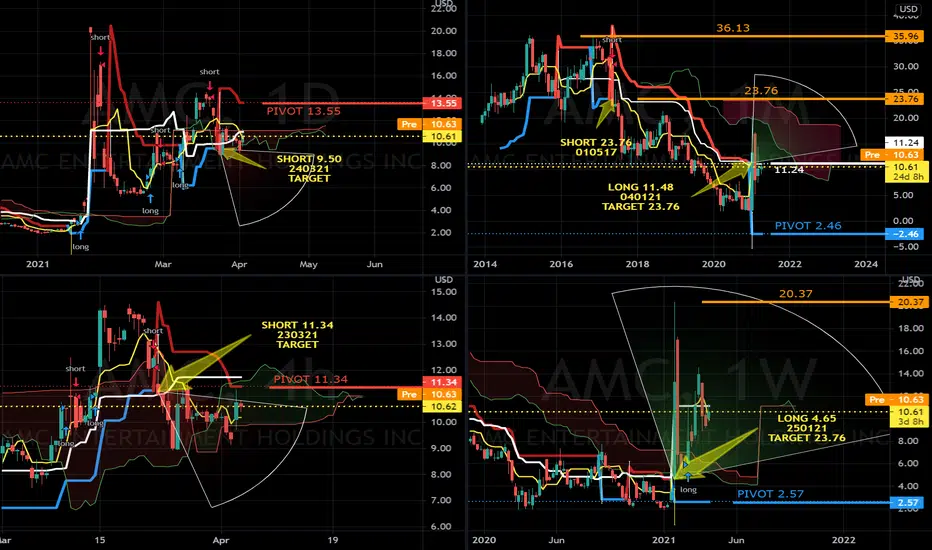
AMC hit an intraday high of $36.13 on 020315 and dropped to $2.00 on the 040121. The stock has been in a downtrend for 4 years since 010517 and is now looking for a recovery bounce since the monthly downtrend supertrend line was broken on 040121 at $11.24. Medium term long signal on 250121 at $4.65 targets $23.76 for a recovery bounce.
Current short term signals are in play since 240321 at the $9.50 level which may test the SSSA line on the weekly cloud at the $6.00 mark.
LONG TERM UPTREND SINCE 040121
MEDIUM TERM UPTREND SINCE 250121
SHORT TERM DOWNTREND SINCE 240321
PIVOT 13.55
Short positions below 13.55 to test 6.00 and 2.57
Long positions above 13.55 to test 20.37 and 23.76
Quant Strategic Singapore
免責聲明
這些資訊和出版物並不意味著也不構成TradingView提供或認可的金融、投資、交易或其他類型的意見或建議。請在使用條款閱讀更多資訊。
Quant Strategic Singapore
免責聲明
這些資訊和出版物並不意味著也不構成TradingView提供或認可的金融、投資、交易或其他類型的意見或建議。請在使用條款閱讀更多資訊。