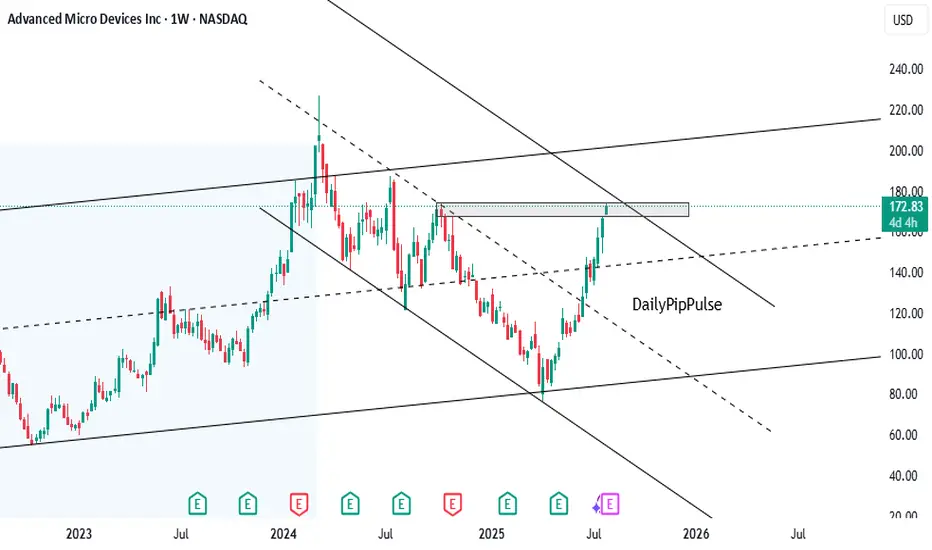
the weekly price action of Advanced Micro Devices Inc (AMD):The stock is trading near a critical resistance zone marked with a rectangular box just below $180.In the past, this area acted as a rejection point, evident from prior pullbacks when the stock neared these levels.
The chart reflects a larger declining channel. Current price action shows AMD approaching the upper boundary of this channel, which may act as dynamic resistance.
If AMD breaks above the $180 resistance convincingly, there’s potential for the stock to aim for higher targets, such as the next major zone ($240).
Failure to break above $180 may lead to a retest of lower levels, potentially near $140 or the breakout zone ($100-$120).
免責聲明
這些資訊和出版物並非旨在提供,也不構成TradingView提供或認可的任何形式的財務、投資、交易或其他類型的建議或推薦。請閱讀使用條款以了解更多資訊。
免責聲明
這些資訊和出版物並非旨在提供,也不構成TradingView提供或認可的任何形式的財務、投資、交易或其他類型的建議或推薦。請閱讀使用條款以了解更多資訊。