Ape Coin (APE) technical analysis:
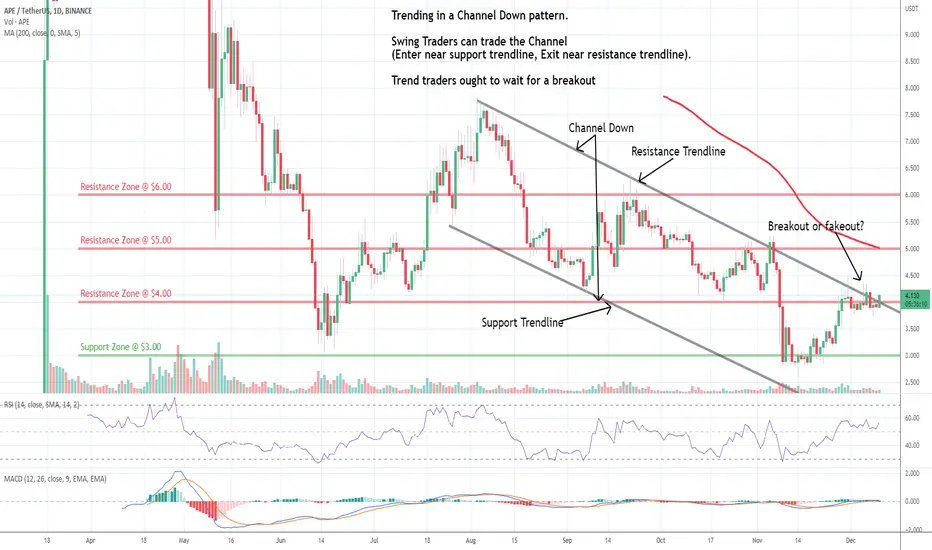
Trade setup: Trading in a Channel Down pattern and appears on the verge of breaking out. Swing traders can trade the Channel (Enter near support trendline, Exit near resistance trendline). Trend traders ought to wait for a breakout. If it breaks out above Resistance Trendline (around $4 currently), price could rally to $5 or higher.
Pattern: Price is trading in a Channel Down pattern. With emerging patterns, traders who believe the price is likely to remain within its channel can initiate trades when the price fluctuates within its channel trendlines. With complete patterns (i.e. a breakout) – initiate a trade when the price breaks through the channel’s trendlines, either on the upper or lower side. When this happens, the price can move rapidly in the direction of that breakout.
Trend: Neutral on Short- and Medium-Term basis and Downtrend on Long-Term basis.
Momentum is Mixed as MACD Line is above MACD Signal Line (Bullish) but RSI ~ 50 (Neutral). MACD Histogram bars are declining, which suggests that momentum is weakening.
Support and Resistance: Nearest Support Zone is $3.00. The nearest Resistance Zone is $4.00, then $5.00, and $6.00.
免責聲明
這些資訊和出版物並不意味著也不構成TradingView提供或認可的金融、投資、交易或其他類型的意見或建議。請在使用條款閱讀更多資訊。