$APUUSDT – Wyckoff Accumulation Pattern (3D Chart)
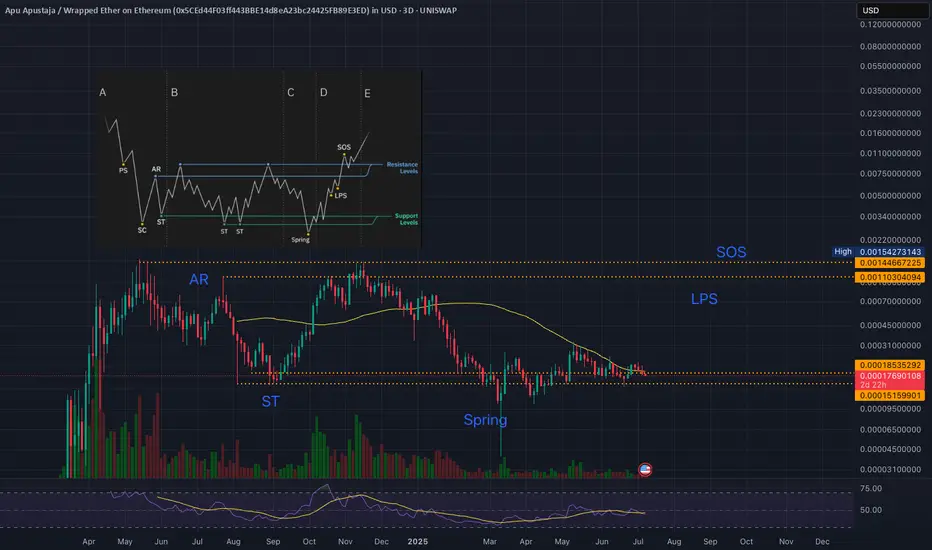
The current structure of AAPU on the 3D timeframe is closely following the classic Wyckoff Accumulation Schematic #1, suggesting a potential major breakout phase might be approaching. Here's the breakdown:
🔍 Wyckoff Phases Identified:
PS (Preliminary Support): Initial buying interest appeared as price declined rapidly.
SC (Selling Climax): Panic selling ended with a strong reaction, forming the bottom.
AR (Automatic Rally): A sharp move up, defining the upper boundary of the trading range.
ST (Secondary Test): Price retested the SC zone, confirming support.
Spring: A shakeout below support, designed to trap bears and absorb supply — we saw this in early 2025.
LPS (Last Point of Support): Price begins to form higher lows with declining volume — currently happening.
SOS (Sign of Strength): Anticipated next phase if breakout above resistance occurs.
🔸 Current Market Context:
Price has completed the Spring phase, bouncing back into the range.
Volume has decreased, consistent with absorption of supply.
A higher low structure is developing post-Spring, indicating demand is increasing.
Real-Time Market Cap: ~$59M USD — still relatively low and suggests room for growth.
Moving averages are flattening out, possibly prepping for a bullish crossover.
🔼 Target Zones (Based on Market Cap):
$0.00296 (MC 1B) 📈
$0.00888 (MC 3B) 🔥
$0.0296 (MC 10B) 🚀
$0.05919 (MC 20B) 🧨
These levels correspond to realistic potential moves if market participation continues and we transition into a full Markup Phase.
📊 Summary:
AAPU appears to be completing its accumulation phase and might be setting up for a Sign of Strength (SOS) soon. A breakout above the LPS zone (~0.0005 USD) with strong volume would confirm entry into Phase E. Keep an eye on volume spikes and price action around the 0.0011–0.0014 USD resistance area.
🔔 Not financial advice – DYOR always.
Let me know your thoughts below or if you see the same Wyckoff structure playing out.
#APU #Wyckoff #Altcoin #CryptoAnalysis #Accumulation #Ethereum #Uniswap #TradingView
免責聲明
這些資訊和出版物並不意味著也不構成TradingView提供或認可的金融、投資、交易或其他類型的意見或建議。請在使用條款閱讀更多資訊。