Hello
I want to make it simpler for those traders who are not sure about this symbol.
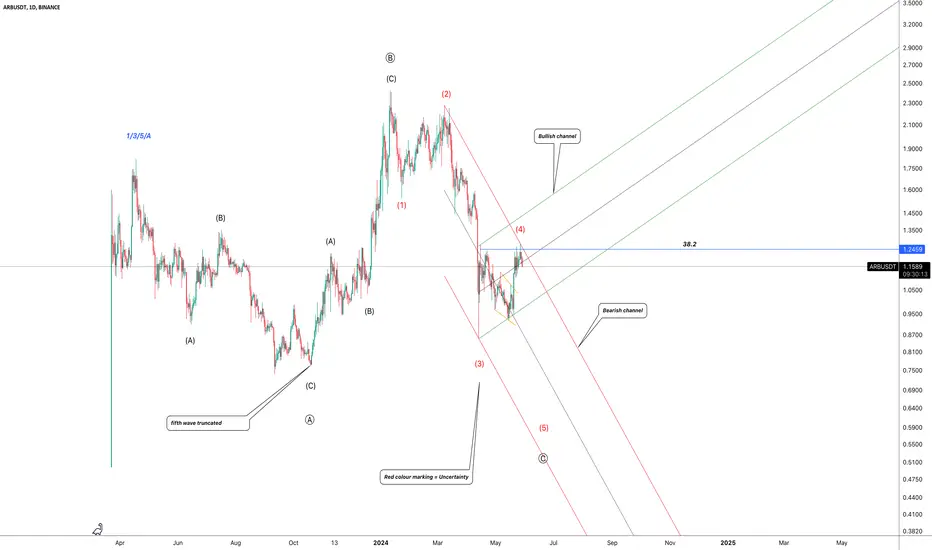
If ARB drops down along side this red boundaries, we can see last bearish fifth wave , but if ARB wants to reverse, so it should break out green channel with strong movements.
Just sit and see for now
Thanks
I want to make it simpler for those traders who are not sure about this symbol.
If ARB drops down along side this red boundaries, we can see last bearish fifth wave , but if ARB wants to reverse, so it should break out green channel with strong movements.
Just sit and see for now
Thanks
註釋
Everything depends on our blue 38.2 Fibo level( static resistance ) with 1.2459 USD price.註釋
How deep will wave (5) correct, you think?免責聲明
這些資訊和出版物並不意味著也不構成TradingView提供或認可的金融、投資、交易或其他類型的意見或建議。請在使用條款閱讀更多資訊。