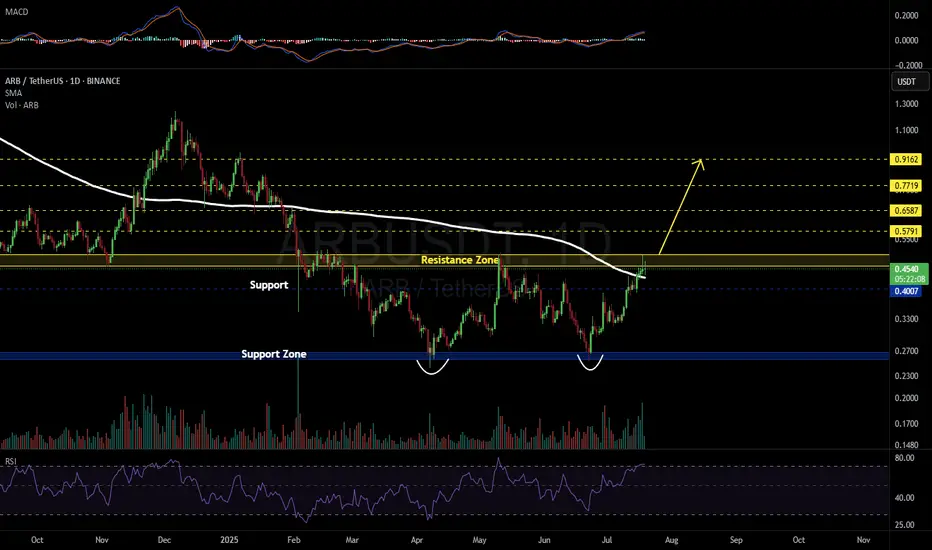
#ARB has formed a Double Bottom Pattern on the daily chart. This is a bullish pattern, and the price is currently moving above the daily SMA200. However, based on the RSI and other indicators, a pullback toward the support level at $0.4007 is possible. In any case, in the event of a breakout above the resistance zone, the targets are:
🎯 $0.5791
🎯 $0.6587
🎯 $0.7719
🎯 $0.9162
⚠️ Always use a tight stop-loss and apply proper risk management.
🎯 $0.5791
🎯 $0.6587
🎯 $0.7719
🎯 $0.9162
⚠️ Always use a tight stop-loss and apply proper risk management.
免責聲明
這些資訊和出版物並不意味著也不構成TradingView提供或認可的金融、投資、交易或其他類型的意見或建議。請在使用條款閱讀更多資訊。
免責聲明
這些資訊和出版物並不意味著也不構成TradingView提供或認可的金融、投資、交易或其他類型的意見或建議。請在使用條款閱讀更多資訊。