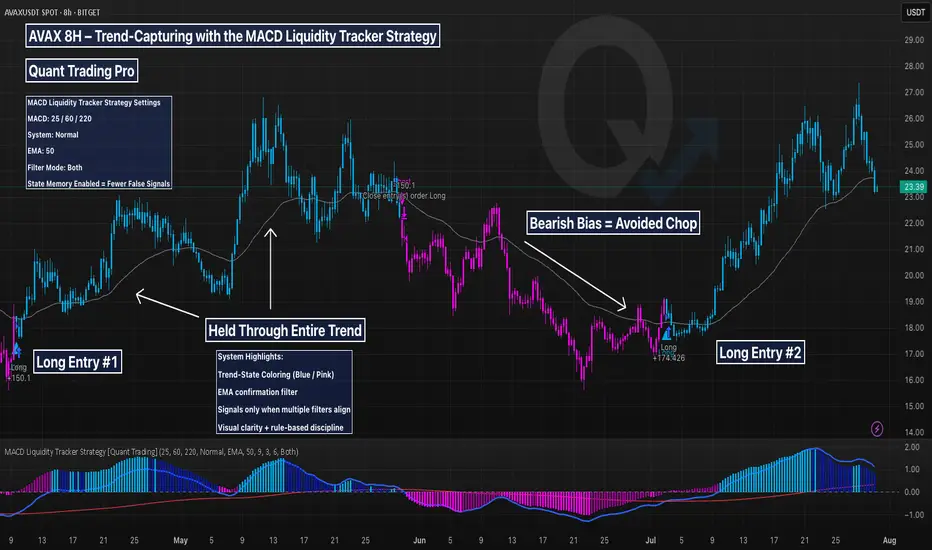
This AVAX 8H chart is a prime example of how the MACD Liquidity Tracker Strategy captures major trends with minimal noise. Designed for swing traders and trend followers, this system uses MACD momentum (25/60/220) and a 50-period EMA to filter entries and avoid chop.
🔍 What This Chart Shows:
A +150% long triggered in April and held cleanly through the rally
No entries during the June downtrend — thanks to bearish state filtering
A fresh +174% long in July as momentum and trend realigned
Visuals are crystal clear:
Blue candles = Bullish bias
Pink candles = Bearish bias
Arrows = Filtered entries only
MACD Histogram = Momentum strength
EMA = Trend direction
🧠 Why It Works:
Most traders struggle with second-guessing and emotional exits. This system removes the guesswork by enforcing strict momentum + trend alignment and delaying signals during unclear price action.
Ideal for crypto traders who want to follow strong trends with confidence and skip the noise in between.
Explore 5,000 Strategies at quanttradingpro.com
Search for the most profitable, lowest risk by symbol!
Search by indicators like Supertrend, Ichimoku, macd.
Join our discord discord.gg/2systG9frc
We provide education & tools.
Search for the most profitable, lowest risk by symbol!
Search by indicators like Supertrend, Ichimoku, macd.
Join our discord discord.gg/2systG9frc
We provide education & tools.
免責聲明
這些資訊和出版物並不意味著也不構成TradingView提供或認可的金融、投資、交易或其他類型的意見或建議。請在使用條款閱讀更多資訊。