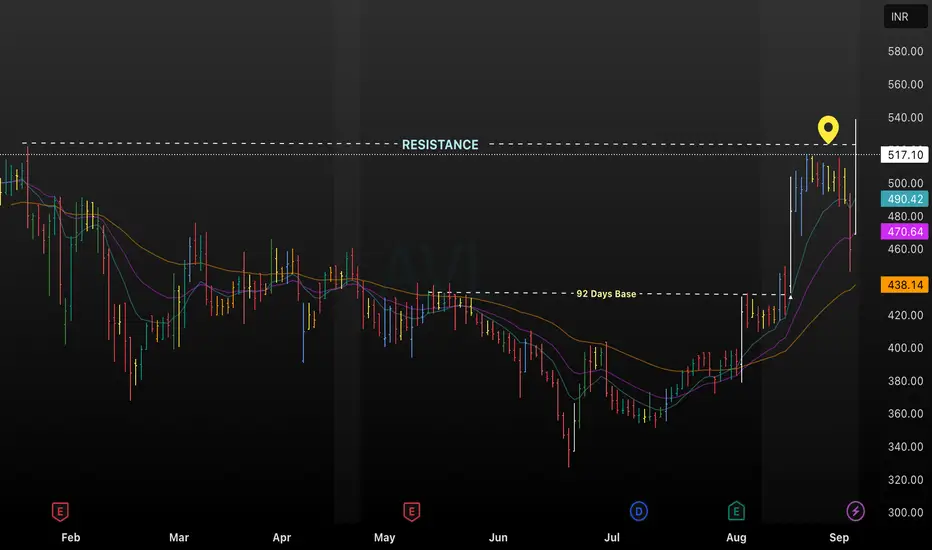
This AVL daily chart highlights a crucial resistance level near ₹540 after a robust 92-day base formation. The recent breakout above this resistance zone signals potential bullish strength, supported by moving averages (EMA 20, 50, 100, 200) currently trending upward above ₹438. A sharp price surge to ₹517 is visible, with strong momentum and historical base support, suggesting possible continuation if resistance sustains.
Use this structure to maximize engagement and provide clarity for community members or followers analyzing AVL’s price action.
Use this structure to maximize engagement and provide clarity for community members or followers analyzing AVL’s price action.
免責聲明
這些資訊和出版物並不意味著也不構成TradingView提供或認可的金融、投資、交易或其他類型的意見或建議。請在使用條款閱讀更多資訊。
免責聲明
這些資訊和出版物並不意味著也不構成TradingView提供或認可的金融、投資、交易或其他類型的意見或建議。請在使用條款閱讀更多資訊。