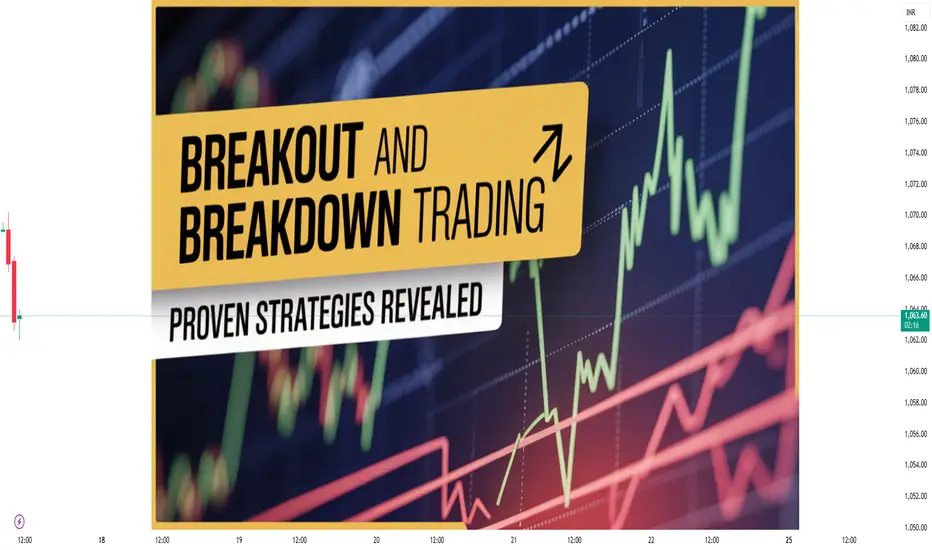
1. Introduction
Trading is not just about buying low and selling high—it’s about identifying when the market is ready to move decisively in a particular direction. Among the most powerful price action-based methods, Breakout and Breakdown strategies have earned their place as timeless tools in a trader’s arsenal.
Breakout: When the price pushes above a significant resistance level or price consolidation zone, signaling potential bullish momentum.
Breakdown: When the price falls below a significant support level or consolidation zone, signaling potential bearish momentum.
The reason these strategies are so popular is simple: when price escapes a strong level, it often triggers a wave of orders—both from new traders entering the market and from existing traders closing losing positions. This can create explosive moves.
2. Understanding Market Structure
Before diving into strategies, it’s important to understand how the market’s “architecture” works.
2.1 Support and Resistance
Support is a price level where buying interest tends to emerge, preventing the price from falling further.
Resistance is a price level where selling pressure tends to emerge, preventing the price from rising further.
A breakout happens when resistance is breached, and a breakdown occurs when support is breached.
2.2 Consolidation Zones
Markets often move sideways before a breakout or breakdown. These “tight” ranges reflect indecision. The tighter the range, the stronger the potential move after the breakout.
2.3 Market Participants
Understanding who’s involved can help:
Retail traders often chase moves.
Institutions accumulate positions quietly during consolidation.
Algorithmic traders may trigger breakouts with large volume spikes.
3. Market Psychology Behind Breakouts & Breakdowns
Price movements are not just numbers; they reflect human emotions—fear, greed, and uncertainty.
3.1 Breakouts
Traders waiting for confirmation jump in as soon as resistance breaks.
Short sellers may cover their positions (buy to exit), adding buying pressure.
Momentum traders and algorithms pile on, accelerating the move.
3.2 Breakdowns
Long holders panic and sell when support breaks.
Short sellers initiate fresh positions.
Stop-loss orders below support get triggered, adding to the downward momentum.
3.3 False Breakouts/Breakdowns
Not every breakout is genuine—sometimes price quickly returns inside the range. This is often due to:
Low volume breakouts.
Manipulative “stop-hunting” by large players.
News events reversing sentiment.
4. Types of Breakout & Breakdown Setups
4.1 Horizontal Level Breakouts
Price breaks a clearly defined horizontal resistance or support.
Works best when levels are tested multiple times before the break.
4.2 Trendline Breakouts
A downward sloping trendline break signals bullish potential.
An upward sloping trendline break signals bearish potential.
4.3 Chart Pattern Breakouts
Ascending Triangle → Breaks upward most often.
Descending Triangle → Breaks downward most often.
Flags/Pennants → Continuation patterns after a sharp move.
Head and Shoulders → Breakdown after neckline breach.
4.4 Range Breakouts
Price has been moving sideways; breaking the range signals a new directional trend.
4.5 Volatility Breakouts
Using Bollinger Bands or ATR to identify when volatility expansion may trigger breakouts.
5. Technical Tools for Breakout & Breakdown Trading
5.1 Volume Analysis
Genuine breakouts usually have above-average volume.
A price breakout without volume can be a trap.
5.2 Moving Averages
Breakouts above the 50-day or 200-day MA often attract attention.
Crossovers can confirm breakouts.
5.3 Bollinger Bands
Breakout beyond the upper band often signals bullish continuation.
Breakdown beyond the lower band often signals bearish continuation.
5.4 Average True Range (ATR)
Helps set stop-losses based on market volatility.
Breakouts with ATR expansion are more reliable.
5.5 RSI & Momentum Indicators
RSI crossing above 50 during a breakout supports bullishness.
Divergences can warn against false moves.
6. Step-by-Step Breakout Trading Strategy
Let’s break down a long breakout strategy:
Identify Key Level
Mark strong resistance levels or consolidation highs.
Wait for Price to Approach
Avoid preemptively entering; wait until price tests the level.
Check Volume Confirmation
Look for higher-than-average volume during the breakout candle.
Entry Trigger
Enter after a candle closes above resistance, not just a wick.
Stop-Loss Placement
Place SL below the breakout candle’s low or below the last swing low.
Profit Targets
First target: Equal to range height.
Second target: Use trailing stop to capture more upside.
7. Step-by-Step Breakdown Trading Strategy
For a short breakdown strategy:
Identify Strong Support
Multiple touches strengthen the level.
Observe Price Action
Watch for compression near support.
Volume Confirmation
High volume on breakdown increases reliability.
Entry
Enter after candle closes below support.
Stop-Loss
Above the breakdown candle high or last swing high.
Profit Targets
First: Range height projection.
Second: Trail stop for extended moves.
8. Risk Management
Breakout and breakdown trading is high-reward but also high-risk without proper risk controls.
8.1 Position Sizing
Risk only 1–2% of capital per trade.
8.2 Avoid Overtrading
Not every breakout is worth trading—quality over quantity.
8.3 Stop-Loss Discipline
Never widen stops once placed.
8.4 Recognizing False Breakouts
No volume surge.
Price rejection at the breakout point.
Sudden reversal candles (shooting star, hammer).
9. Advanced Tips for Success
9.1 Multi-Timeframe Analysis
Confirm breakouts on higher timeframes for reliability.
9.2 Retest Entries
Instead of chasing the breakout, wait for price to retest the broken level and bounce.
9.3 Combine With Indicators
MACD crossovers, RSI breakouts, or Ichimoku Cloud confirmations can filter false signals.
9.4 Avoid News-Driven Breakouts
These are often short-lived spikes unless supported by strong fundamentals.
10. Real-World Example
Breakout Example
Stock consolidates between ₹950–₹1000 for weeks.
Volume surges as it closes at ₹1015.
Entry at ₹1015, SL at ₹990.
Price rallies to ₹1080 within days.
Breakdown Example
Nifty support at 19,800 tested thrice.
Price closes at 19,750 with high volume.
Short entry at 19,750, SL at 19,880.
Price drops to 19,500.
11. Pros and Cons
Pros:
Captures explosive moves early.
Works in all markets (stocks, forex, crypto).
High reward-to-risk potential.
Cons:
False breakouts can be frustrating.
Requires discipline to wait for confirmation.
Volatility can trigger stop-losses before the real move.
12. Summary Table: Breakout vs Breakdown
Feature Breakout (Long) Breakdown (Short)
Key Level Resistance Support
Volume Signal High volume on upward candle High volume on downward candle
Stop-Loss Below breakout candle low Above breakdown candle high
Target Range height or trend ride Range height or trend ride
13. Final Thoughts
Breakout and breakdown strategies work because they align with the natural order flow of the market—when key levels are breached, they often trigger a flood of buying or selling activity. However, success depends heavily on patience, confirmation, and risk management.
A trader who learns to differentiate between a true breakout and a false move has a powerful edge. By combining technical levels, volume analysis, and disciplined execution, breakout/breakdown trading can become a cornerstone strategy in any trading plan.
I built a Buy & Sell Signal Indicator with 85% accuracy.
📈 Get access via DM or
WhatsApp: wa.link/d997q0
Contact - +91 76782 40962
| Email: techncialexpress@gmail.com
| Script Coder | Trader | Investor | From India
📈 Get access via DM or
WhatsApp: wa.link/d997q0
Contact - +91 76782 40962
| Email: techncialexpress@gmail.com
| Script Coder | Trader | Investor | From India
相關出版品
免責聲明
這些資訊和出版物並非旨在提供,也不構成TradingView提供或認可的任何形式的財務、投資、交易或其他類型的建議或推薦。請閱讀使用條款以了解更多資訊。