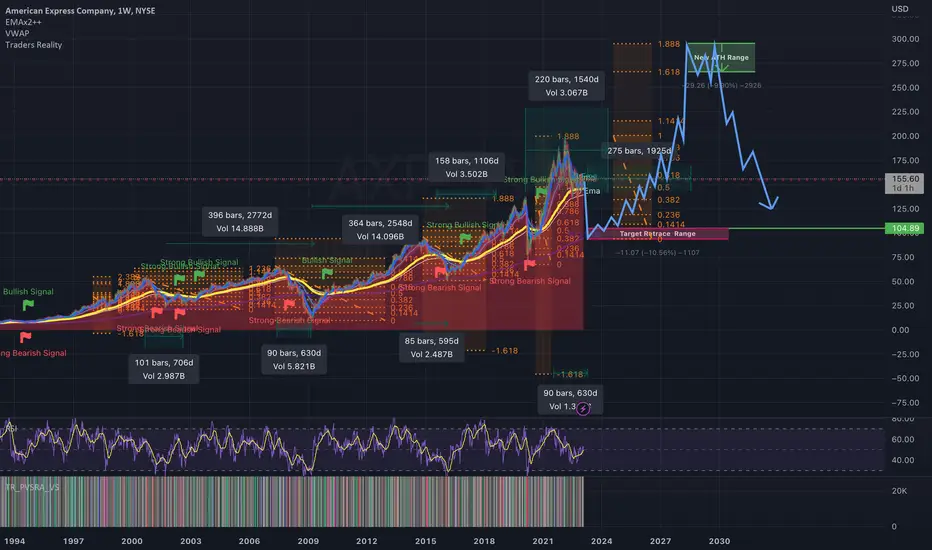
The peaks and valleys of the AXP chart are extremely consistent over time. Every 7 years we see a cycle where we achieve a new ATH and retrace sharply before repeating the cycle. The time ranges in which the elements of this pattern play out are shown. The time it typically takes from peak to low and the time from low to peak. Based on these consistent time and price patterns, this shows my prediction for upcoming cycle low and the following cycle peak. The 7 year cycle is known as the Shamita. It plays a fundamental part in the ebbs and flows of the global financial markets.
免責聲明
這些資訊和出版物並不意味著也不構成TradingView提供或認可的金融、投資、交易或其他類型的意見或建議。請在使用條款閱讀更多資訊。