✨ শুভ শারদীয়া দুর্গোৎসবের আন্তরিক শুভেচ্ছা ও অভিনন্দন ✨
Technical Analysis: Bank Nifty (as of Sep 30, 2025) for 01st Oct 2025
Nifty is exhibiting a clear and strong bullish momentum, trading near the peak of a significant upward move. This is in stark contrast to the Nifty 50, which was in a consolidation phase.
1. Overall Market Structure
• Short-Term Trend: Strongly Bullish. The chart shows a consistent and powerful uptrend characterized by a series of Higher Highs and Higher Lows. The index has rallied from a low near ~54,226 to a high near 54,775.
• Key Observation: The trend is mature but shows no signs of reversal at this moment. The price is hovering near the highs, suggesting sustained buying interest.
2. Key Technical Levels
• Resistances: Plotted on Chart
• Supports: Plotted on Chart
3. Price Action and Candlestick Analysis
• The chart displays a classic "Rising Channel" or a series of impulsive upward moves followed by shallow, sideways corrections. This indicates strong underlying demand.
• The candles show strong bullish bodies during the up-moves, with the recent candles consolidating near the highs. This is a sign of strength, not weakness, as the market is not giving up its gains.
4. Volume Analysis
• The provided volume (22.44M) is a cumulative figure. In a strong trend like this, one would typically expect to see higher volume on up-moves and lower volume on corrections, confirming the bullish bias.
5. Outlook and Potential Scenarios
• Bullish Scenario (Higher Probability): The path of least resistance is to the upside. A sustained break above 54,750 confirms the continuation of the uptrend, with targets at 54,890 and 55,025.
• Neutral/Consolidation Scenario: The index may enter a period of consolidation or a shallow pullback to digest the recent sharp gains. As long as it holds above the 54,350 support, the overall bullish structure remains intact.
• Bearish Scenario (Lower Probability): A decisive break and close below the 54,350 - 54,250 support level would be the first sign of weakness and could lead to a deeper correction towards 54,080 - 53950.
Summary
Bank Nifty is in a commanding bullish trend and is significantly outperforming the Nifty 50 index in the short term. The momentum is strong, and the structure is healthy.
• For Bulls: The trend is your friend. Any dip towards the 54,325 - 54,250 support zone can be seen as a potential buying opportunity, with a stop loss below 54,200.
• For Bears: There are no signs of a top yet. Standing in the way of this trend is risky. One should wait for a clear break of support (below 54,200) and a change in the Higher High structure before considering short positions.
The immediate trigger for the next big move is a break above 54,780 (for a new rally) or a break below 54,200 (for a correction)
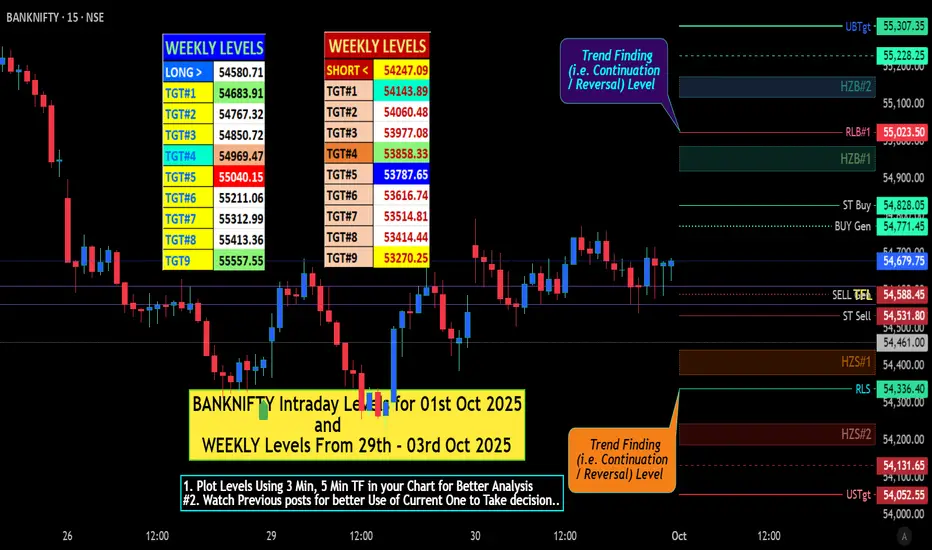
# "WEEKLY Levels" mentioned in BOX format.
^^^^^^^Plot Levels Using 3 Min, 5 Min Time frame in your Chart for Better Analysis^^^^^^^
L#1: If the candle crossed & stays above the “Buy Gen”, it is treated / considered as Bullish bias.
L#2: Possibility / Probability of REVERSAL near RLB#1 & UBTgt
L#3: If the candle stays above “Sell Gen” but below “Buy Gen”, it is treated / considered as Sidewise. Aggressive Traders can take Long position near “Sell Gen” either retesting or crossed from Below & vice-versa i.e. can take Short position near “Buy Gen” either retesting or crossed downward from Above.
L#4: If the candle crossed & stays below the “Sell Gen”, it is treated / considered a Bearish bias.
L#5: Possibility / Probability of REVERSAL near RLS#1 & USTgt
HZB (Buy side) & HZS (Sell side) => Hurdle Zone,
*** Specialty of “HZB#1, HZB#2 HZS#1 & HZS#2” is Sidewise (behaviour in Nature)
Rest Plotted and Mentioned on Chart
Color code Used:
Green =. Positive bias.
Red =. Negative bias.
RED in Between Green means Trend Finder / Momentum Change
/ CYCLE Change and Vice Versa.
Notice One thing: HOW LEVELS are Working.
Use any Momentum Indicator / Oscillatoror as you "USED to" to Take entry.
⚠️ DISCLAIMER:
The information, views, and ideas shared here are purely for educational and informational purposes only. They are not intended as investment advice or a recommendation to buy, sell, or hold any financial instruments. I am not a SEBI-registered financial adviser.
Trading and investing in the stock market involves risk, and you should do your own research and analysis. You are solely responsible for any decisions made based on this research.
"As HARD EARNED MONEY IS YOUR's, So DECISION SHOULD HAVE TO BE YOUR's".
Do comment if Helpful.
Technical Analysis: Bank Nifty (as of Sep 30, 2025) for 01st Oct 2025
Nifty is exhibiting a clear and strong bullish momentum, trading near the peak of a significant upward move. This is in stark contrast to the Nifty 50, which was in a consolidation phase.
1. Overall Market Structure
• Short-Term Trend: Strongly Bullish. The chart shows a consistent and powerful uptrend characterized by a series of Higher Highs and Higher Lows. The index has rallied from a low near ~54,226 to a high near 54,775.
• Key Observation: The trend is mature but shows no signs of reversal at this moment. The price is hovering near the highs, suggesting sustained buying interest.
2. Key Technical Levels
• Resistances: Plotted on Chart
• Supports: Plotted on Chart
3. Price Action and Candlestick Analysis
• The chart displays a classic "Rising Channel" or a series of impulsive upward moves followed by shallow, sideways corrections. This indicates strong underlying demand.
• The candles show strong bullish bodies during the up-moves, with the recent candles consolidating near the highs. This is a sign of strength, not weakness, as the market is not giving up its gains.
4. Volume Analysis
• The provided volume (22.44M) is a cumulative figure. In a strong trend like this, one would typically expect to see higher volume on up-moves and lower volume on corrections, confirming the bullish bias.
5. Outlook and Potential Scenarios
• Bullish Scenario (Higher Probability): The path of least resistance is to the upside. A sustained break above 54,750 confirms the continuation of the uptrend, with targets at 54,890 and 55,025.
• Neutral/Consolidation Scenario: The index may enter a period of consolidation or a shallow pullback to digest the recent sharp gains. As long as it holds above the 54,350 support, the overall bullish structure remains intact.
• Bearish Scenario (Lower Probability): A decisive break and close below the 54,350 - 54,250 support level would be the first sign of weakness and could lead to a deeper correction towards 54,080 - 53950.
Summary
Bank Nifty is in a commanding bullish trend and is significantly outperforming the Nifty 50 index in the short term. The momentum is strong, and the structure is healthy.
• For Bulls: The trend is your friend. Any dip towards the 54,325 - 54,250 support zone can be seen as a potential buying opportunity, with a stop loss below 54,200.
• For Bears: There are no signs of a top yet. Standing in the way of this trend is risky. One should wait for a clear break of support (below 54,200) and a change in the Higher High structure before considering short positions.
The immediate trigger for the next big move is a break above 54,780 (for a new rally) or a break below 54,200 (for a correction)
# "WEEKLY Levels" mentioned in BOX format.
^^^^^^^Plot Levels Using 3 Min, 5 Min Time frame in your Chart for Better Analysis^^^^^^^
L#1: If the candle crossed & stays above the “Buy Gen”, it is treated / considered as Bullish bias.
L#2: Possibility / Probability of REVERSAL near RLB#1 & UBTgt
L#3: If the candle stays above “Sell Gen” but below “Buy Gen”, it is treated / considered as Sidewise. Aggressive Traders can take Long position near “Sell Gen” either retesting or crossed from Below & vice-versa i.e. can take Short position near “Buy Gen” either retesting or crossed downward from Above.
L#4: If the candle crossed & stays below the “Sell Gen”, it is treated / considered a Bearish bias.
L#5: Possibility / Probability of REVERSAL near RLS#1 & USTgt
HZB (Buy side) & HZS (Sell side) => Hurdle Zone,
*** Specialty of “HZB#1, HZB#2 HZS#1 & HZS#2” is Sidewise (behaviour in Nature)
Rest Plotted and Mentioned on Chart
Color code Used:
Green =. Positive bias.
Red =. Negative bias.
RED in Between Green means Trend Finder / Momentum Change
/ CYCLE Change and Vice Versa.
Notice One thing: HOW LEVELS are Working.
Use any Momentum Indicator / Oscillatoror as you "USED to" to Take entry.
⚠️ DISCLAIMER:
The information, views, and ideas shared here are purely for educational and informational purposes only. They are not intended as investment advice or a recommendation to buy, sell, or hold any financial instruments. I am not a SEBI-registered financial adviser.
Trading and investing in the stock market involves risk, and you should do your own research and analysis. You are solely responsible for any decisions made based on this research.
"As HARD EARNED MONEY IS YOUR's, So DECISION SHOULD HAVE TO BE YOUR's".
Do comment if Helpful.
相關出版品
免責聲明
The information and publications are not meant to be, and do not constitute, financial, investment, trading, or other types of advice or recommendations supplied or endorsed by TradingView. Read more in the Terms of Use.
相關出版品
免責聲明
The information and publications are not meant to be, and do not constitute, financial, investment, trading, or other types of advice or recommendations supplied or endorsed by TradingView. Read more in the Terms of Use.