\📊 BANK NIFTY TRADING PLAN – 30-Jun-2025\
📍 \Previous Close:\ 57,400
📏 \Gap Reference Threshold:\ ±200 points
🕒 \Timeframe:\ 15-Min
📈 \Chart Zones Used:\ No Trade Zone, Support & Resistance areas
---
\
\[\*]\🚀 GAP-UP OPENING (Above 57,785):\
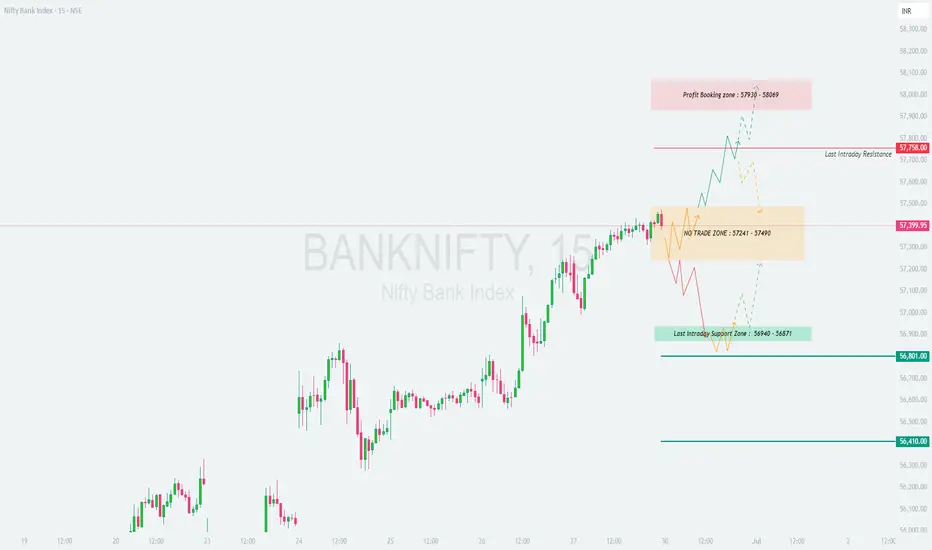
If Bank Nifty opens with a gap-up above \57,785\, it will immediately enter the \Profit Booking Zone (57,930 – 58,069)\. In this case, traders should be alert for potential exhaustion or consolidation in that zone. Avoid chasing the move unless a breakout is clean with strong follow-through volume.
✅ \Plan of Action:\
• Wait for price to test 57,930–58,069
• Enter long only if price consolidates and breaks out above 58,069 with good volume
• Watch for profit booking candles or bearish reversal near 58,000 zone
🎯 \Trade Setup:\
– \Buy:\ Only above 58,069 (confirmed breakout)
– \Target:\ 58,300+
– \SL:\ Below 57,785
📘 \Tip:\ Opening spikes often trap traders. Wait 15–30 mins before entering a trade after a gap-up.
\[\*]\⚖️ FLAT OPENING (Between 57,241 – 57,490):\
This area is defined as a \No Trade Zone\ due to expected choppy price action. Markets may consolidate or trap both bulls and bears. Best to avoid any directional trades here unless a breakout occurs with conviction.
✅ \Plan of Action:\
• No trade inside the zone (wait for breakout)
• If price breaks above 57,490 with volume → Long setup
• If price breaks below 57,241 → Short setup initiated
🎯 \Trade Setup Options:\
– \Buy:\ Only above 57,490
– \Sell:\ Only below 57,241
– \Targets:\ 57,785 (upside), 56,940 (downside)
– \SL:\ Opposite end of the zone or recent 15-min swing
📘 \Tip:\ In flat opens, structure develops post 9:30 AM. Be patient and follow only clear breakouts with volume.
\[\*]\📉 GAP-DOWN OPENING (Below 56,940):\
A gap-down below \56,940\ pushes the market into the \Last Intraday Support Zone (56,940 – 56,871)\. If this zone fails to hold, the next major support is at \56,410\. This setup favors sellers but must be executed after observing initial rejection or acceptance of the lower levels.
✅ \Plan of Action:\
• Short below 56,871 if initial candle confirms breakdown
• If price quickly reclaims 56,940, avoid shorts — it could trap bears
• Watch reversal pattern near 56,410 for potential long
🎯 \Trade Setup:\
– \Sell:\ Below 56,871
– \Target:\ 56,410
– \SL:\ Above 56,940
📘 \Tip:\ Don’t rush short trades. Let the price confirm failure of support before initiating.
---
\🧩 KEY ZONES TO TRACK:\
🔴 \Profit Booking:\ 57,930 – 58,069
🔴 \Last Intraday Resistance:\ 57,785
🟧 \No Trade Zone:\ 57,241 – 57,490
🟩 \Last Intraday Support:\ 56,940 – 56,871
🟦 \Major Support:\ 56,410
---
\💡 OPTIONS TRADING TIPS (For Intraday Traders):\
✅ Prefer ATM strikes in high IV zones to avoid time decay
✅ Use spreads (Bull Call / Bear Put) in low volatility conditions
✅ Avoid deep OTM buying on Friday due to Theta erosion
✅ Keep SL fixed: Options can lose value quickly after reversals
✅ Hedge naked options with proper risk-defined trades
✅ Monitor Open Interest buildup around support/resistance levels
---
\📌 SUMMARY – STRATEGY AT A GLANCE:\
• ✅ \Bullish above:\ 57,490 → Potential up move till 57,785 and 58,069
• ⛔️ \Sideways inside:\ 57,241 – 57,490 → Avoid trades in this zone
• ❌ \Bearish below:\ 56,871 → Breakdown setup with next support at 56,410
• 🧠 \Core Idea:\ Let price lead. React, don’t predict blindly.
---
\⚠️ DISCLAIMER:\
I am not a SEBI-registered advisor. This analysis is meant purely for educational purposes. Traders are advised to consult their financial advisor and manage risk strictly. Always use stop-loss and proper position sizing.
免責聲明
這些資訊和出版物並不意味著也不構成TradingView提供或認可的金融、投資、交易或其他類型的意見或建議。請在使用條款閱讀更多資訊。
免責聲明
這些資訊和出版物並不意味著也不構成TradingView提供或認可的金融、投資、交易或其他類型的意見或建議。請在使用條款閱讀更多資訊。