Timeframes & Context
We have three different timeframes: Daily (1D), 4-Hour (4H), and 1-Hour (1H).
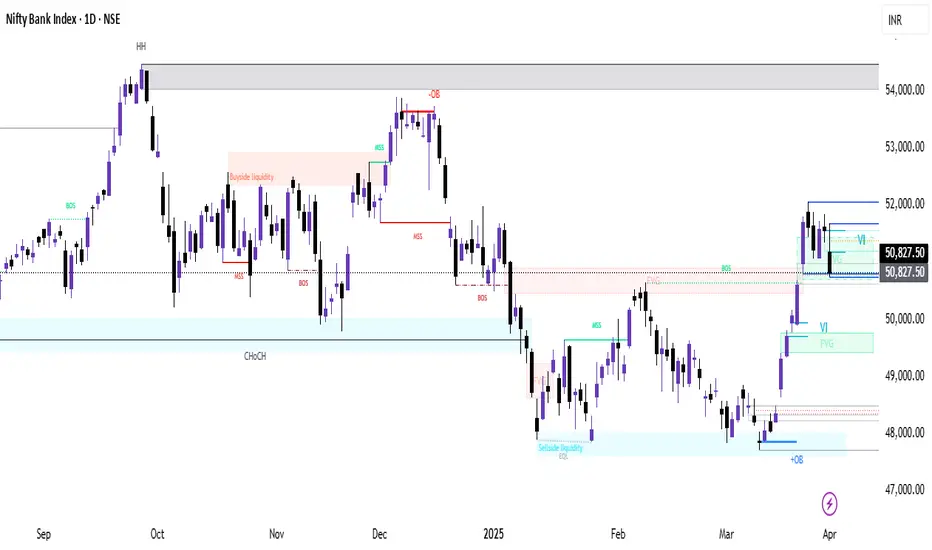
1D gives us the macro view, showing key liquidity zones, order blocks (OBs), and break of structure (BOS).
4H refines our zones, helping to confirm areas of interest.
1H is the execution timeframe, where we define entry, stop-loss, and profit targets.
1️⃣ Higher Timeframe Bias - Daily Chart
📌 Key Observations:
A strong rejection from a higher timeframe supply zone near 52,000 - 52,400.
A liquidity grab (buy-side liquidity sweep) followed by a market structure shift (MSS) confirms bearish intent.
Break of Structure (BOS) indicates a downward trend continuation.
Fair Value Gaps (FVGs) suggest imbalance that the price may revisit before continuation.
📌 Bias: Bearish, expecting price to move lower.
📌 Key Levels:
Supply Zone (Resistance): 51,800 - 52,400
Demand Zone (Support): 48,000 - 49,000
Potential Target: 49,000 (near previous liquidity and OB)
2️⃣ Mid-Timeframe Confirmation - 4H Chart
📌 Key Observations:
A strong volume imbalance (VI) after the downward move.
Price has consolidated inside a 1H Fair Value Gap (FVG), signaling a possible retracement.
The previous low at 50,750 is being tested multiple times, suggesting liquidity is building.
📌 Bias: Bearish
Looking for a retracement to 51,200 - 51,400 (FVG area) before continuing downward.
Break below 50,750 confirms further selling.
📌 Key Levels:
Resistance: 51,200 - 51,400 (FVG + OB)
Support: 50,400 (short-term), 49,500 (major)
3️⃣ Entry Plan - 1H Execution Chart
📌 Trade Idea:
Wait for price to retest 51,200 - 51,400 (FVG zone).
If we see rejection (e.g., bearish engulfing candle or liquidity sweep), enter a short trade.
📌 Trade Parameters:
Entry: 51,200 - 51,400
Stop Loss: 51,600 (above OB)
Target 1 (T1): 50,400
Target 2 (T2): 49,500
Risk-Reward Ratio (RRR): ~1:3 or better
📌 Alternative Scenario:
If price breaks above 51,600, we invalidate the short setup.
In that case, we will reassess for a bullish continuation.
We have three different timeframes: Daily (1D), 4-Hour (4H), and 1-Hour (1H).
1D gives us the macro view, showing key liquidity zones, order blocks (OBs), and break of structure (BOS).
4H refines our zones, helping to confirm areas of interest.
1H is the execution timeframe, where we define entry, stop-loss, and profit targets.
1️⃣ Higher Timeframe Bias - Daily Chart
📌 Key Observations:
A strong rejection from a higher timeframe supply zone near 52,000 - 52,400.
A liquidity grab (buy-side liquidity sweep) followed by a market structure shift (MSS) confirms bearish intent.
Break of Structure (BOS) indicates a downward trend continuation.
Fair Value Gaps (FVGs) suggest imbalance that the price may revisit before continuation.
📌 Bias: Bearish, expecting price to move lower.
📌 Key Levels:
Supply Zone (Resistance): 51,800 - 52,400
Demand Zone (Support): 48,000 - 49,000
Potential Target: 49,000 (near previous liquidity and OB)
2️⃣ Mid-Timeframe Confirmation - 4H Chart
📌 Key Observations:
A strong volume imbalance (VI) after the downward move.
Price has consolidated inside a 1H Fair Value Gap (FVG), signaling a possible retracement.
The previous low at 50,750 is being tested multiple times, suggesting liquidity is building.
📌 Bias: Bearish
Looking for a retracement to 51,200 - 51,400 (FVG area) before continuing downward.
Break below 50,750 confirms further selling.
📌 Key Levels:
Resistance: 51,200 - 51,400 (FVG + OB)
Support: 50,400 (short-term), 49,500 (major)
3️⃣ Entry Plan - 1H Execution Chart
📌 Trade Idea:
Wait for price to retest 51,200 - 51,400 (FVG zone).
If we see rejection (e.g., bearish engulfing candle or liquidity sweep), enter a short trade.
📌 Trade Parameters:
Entry: 51,200 - 51,400
Stop Loss: 51,600 (above OB)
Target 1 (T1): 50,400
Target 2 (T2): 49,500
Risk-Reward Ratio (RRR): ~1:3 or better
📌 Alternative Scenario:
If price breaks above 51,600, we invalidate the short setup.
In that case, we will reassess for a bullish continuation.
免責聲明
這些資訊和出版物並不意味著也不構成TradingView提供或認可的金融、投資、交易或其他類型的意見或建議。請在使用條款閱讀更多資訊。