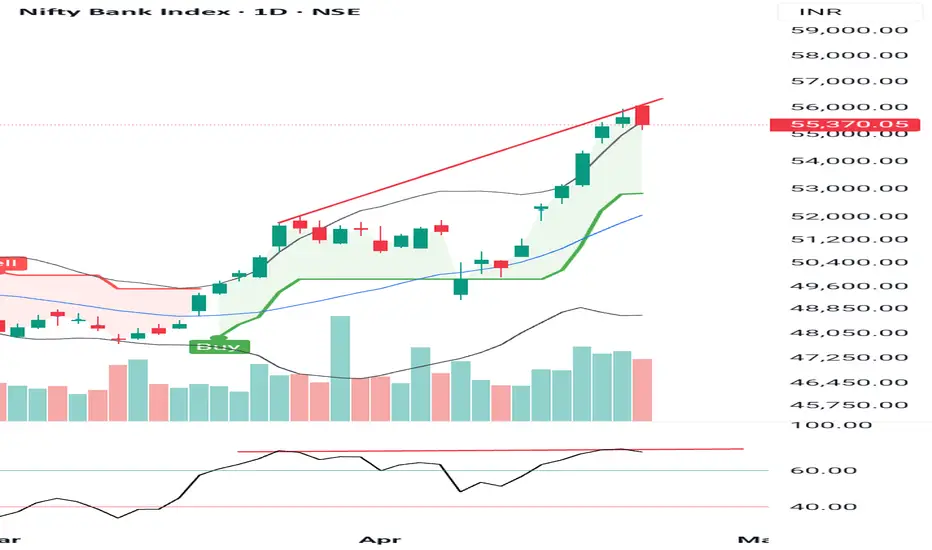
Bank nifty is forming a Negative RSI divergence on daily chart with Bearish Engulfing pattern
Bearish Engulfing pattern formed is a perfect text book case
Seems as if fuel of short covering is getting exhausted and index may see some profit booking or consolidation, even a mild retracement also can't be ruled out
Caution: RSI on all time frames ( D/W/M)is above 60
Lets see how it evolves from here further
Disclaimer: NOT A BUY / SELL RECOMMENDATION I am not an expert I just share interesting charts here for educational purpose and not to be taken as buy/sell recommendation. Please seek expert opinion before investing and trading as trading/ investing in market is subject to market risks. I do not hold any position in the index as on date but I may look to take some position with my own Risk Reward matrix.
免責聲明
這些資訊和出版物並不意味著也不構成TradingView提供或認可的金融、投資、交易或其他類型的意見或建議。請在使用條款閱讀更多資訊。
免責聲明
這些資訊和出版物並不意味著也不構成TradingView提供或認可的金融、投資、交易或其他類型的意見或建議。請在使用條款閱讀更多資訊。