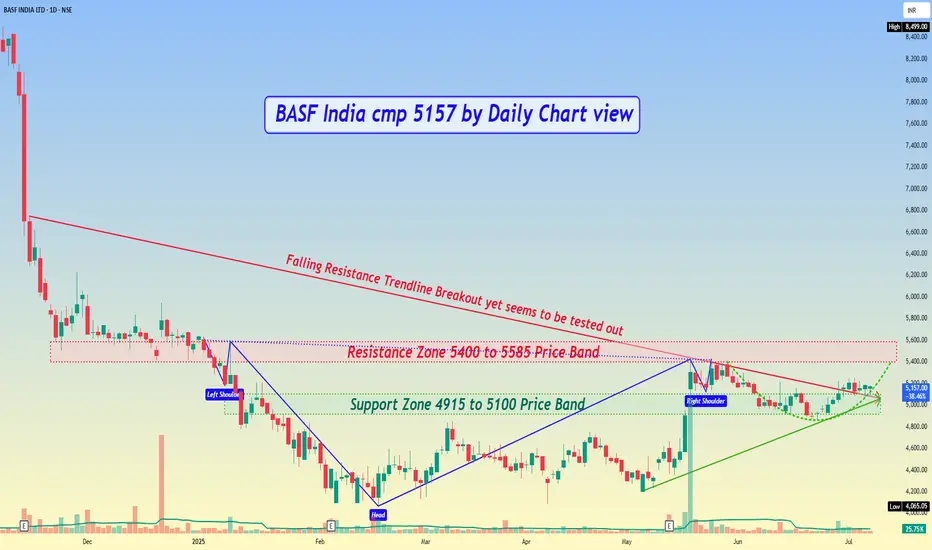
BASF India cmp 5157 by Daily Chart view
- Support Zone 4915 to 5100 Price Band
- Resistance Zone 5400 to 5585 Price Band
- Stock Price is in the process of Support Zone testing retesting
- Falling Resistance Trendline Breakout yet seems to be tested out
- Rising Support Trendline seems well respected and price well above it
- Bullish Head & Shoulder followed by a Rounding Bottom in completion stage
- Volumes seem to be on selling side, need to increase for fresh upside price movement
- Majority of the Technical Indicators seem to be turning positive for BB, EMA, MACD, RSI, SAR
免責聲明
這些資訊和出版物並非旨在提供,也不構成TradingView提供或認可的任何形式的財務、投資、交易或其他類型的建議或推薦。請閱讀使用條款以了解更多資訊。
免責聲明
這些資訊和出版物並非旨在提供,也不構成TradingView提供或認可的任何形式的財務、投資、交易或其他類型的建議或推薦。請閱讀使用條款以了解更多資訊。